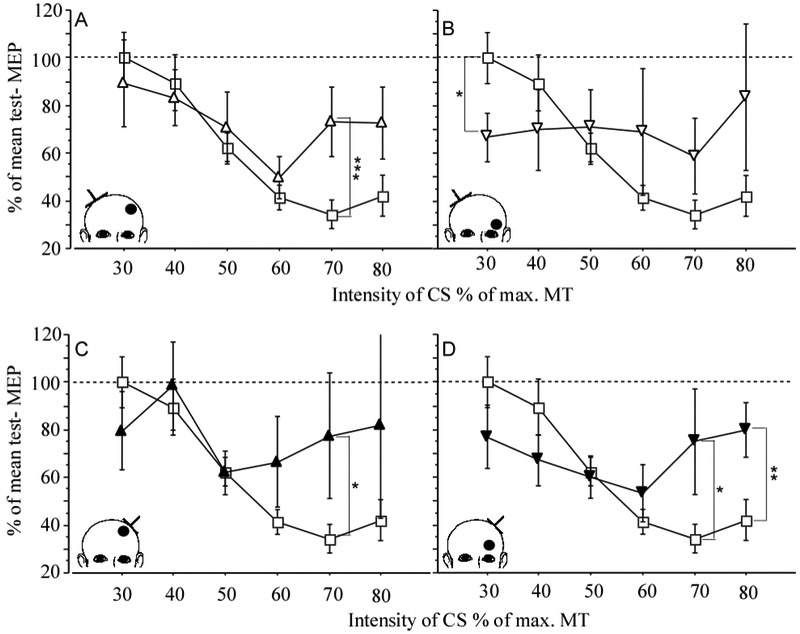
Figure 3.
Effect of stroke location along the primary motor output (either cortical or subcortical) on primary motor cortex excitability. Paired pulse TMS was used to measure short interval cortical inhibition (SICI) in 23 chronic stroke patients. The data was compared to 20 healthy age matched controls. Upper panel: CONTROL (square) and contra-lesional M1 of patients with cortical (open triangle, A) and subcortical location of infarction (open inverted triangle, B). Lower panel: CONTROL (squares) and ipsilesional M1 of patients with cortical (black triangle, C) and subcortical location of infarction (black inverted triangle, D). Mean ± SE. * p< .05, ** p< .02, *** p< .01. Inserts illustrate the location of the lesion (black dot) and the site of TMS (inverted T). CS= intensity of conditioning stimulus, MT = motor threshold. (Butefisch et al., 2008).

