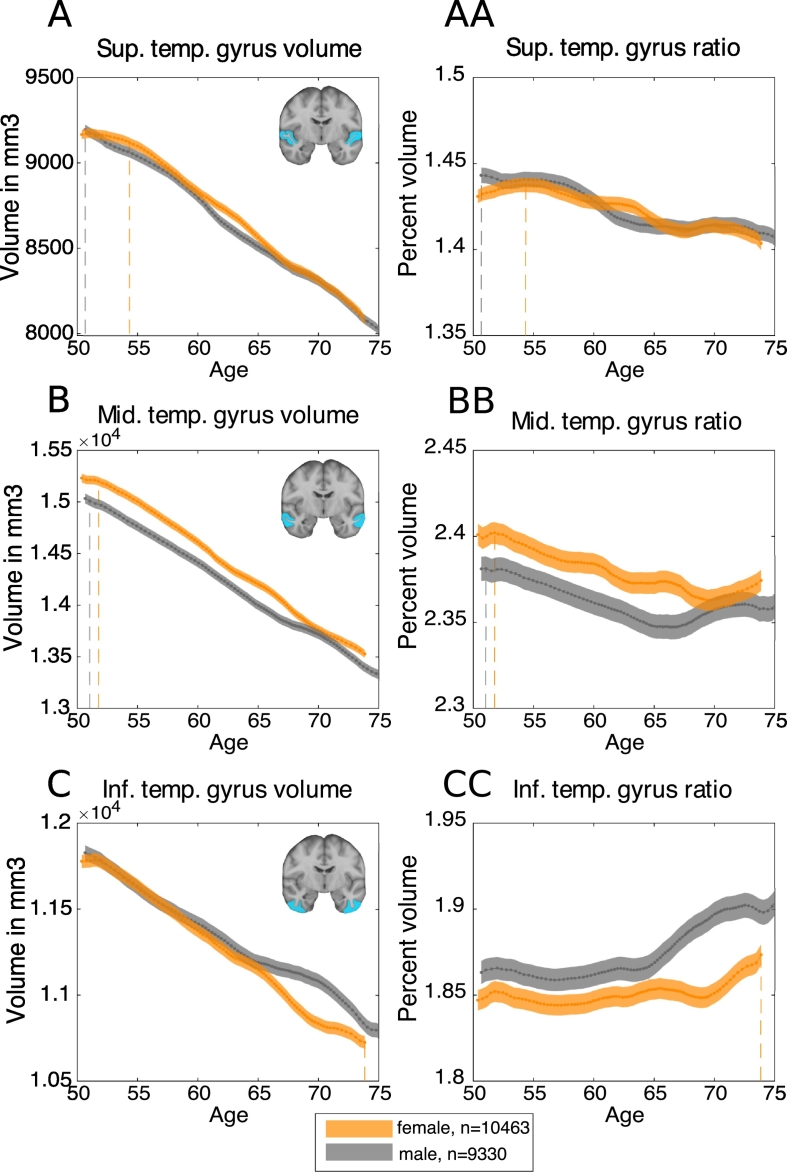
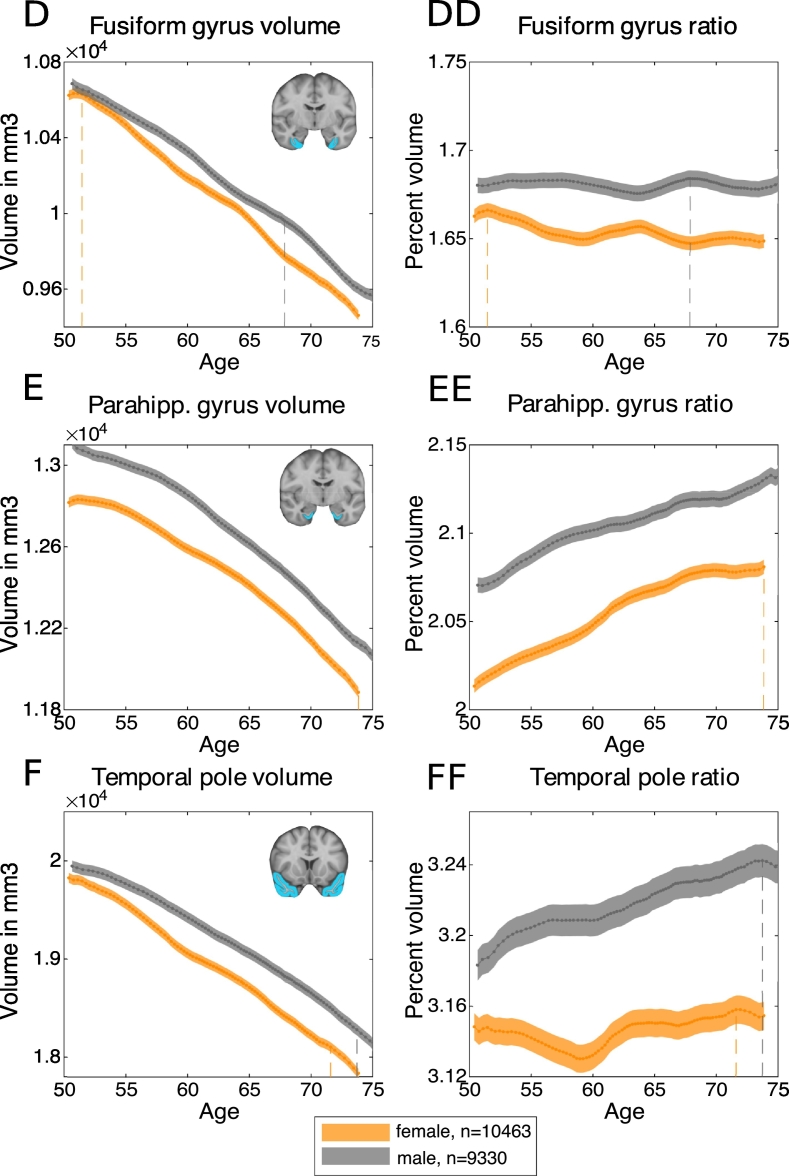
Fig. 10.
Trajectory of temporal lobe volumes with age, corrected for head-size.
Dashed lines indicate points of maximum ratio. A. Bilateral superior temporal gyrus volume. AA. Bilateral superior temporal gyrus ratio to rest of grey matter. B. Bilateral middle temporal gyrus volume. BB. Bilateral middle temporal gyrus ratio to rest of grey matter. C. Bilateral inferior temporal gyrus volume. CC. Bilateral inferior temporal gyrus ratio to rest of grey matter. D. Bilateral fusiform gyrus volume. DD. Bilateral fusiform gyrus ratio to rest of grey matter. E. Bilateral parahippocampal gyrus volume. EE. Bilateral parahippocampal gyrus ratio to rest of grey matter. F. Bilateral temporal pole volume. FF. Bilateral temporal pole ratio to rest of grey matter.


