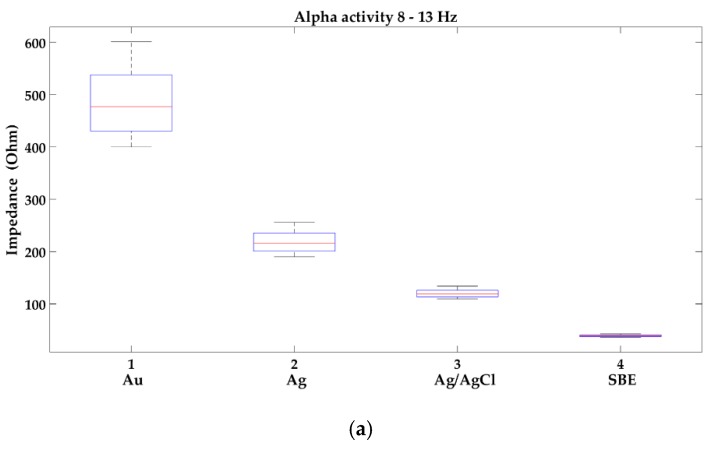
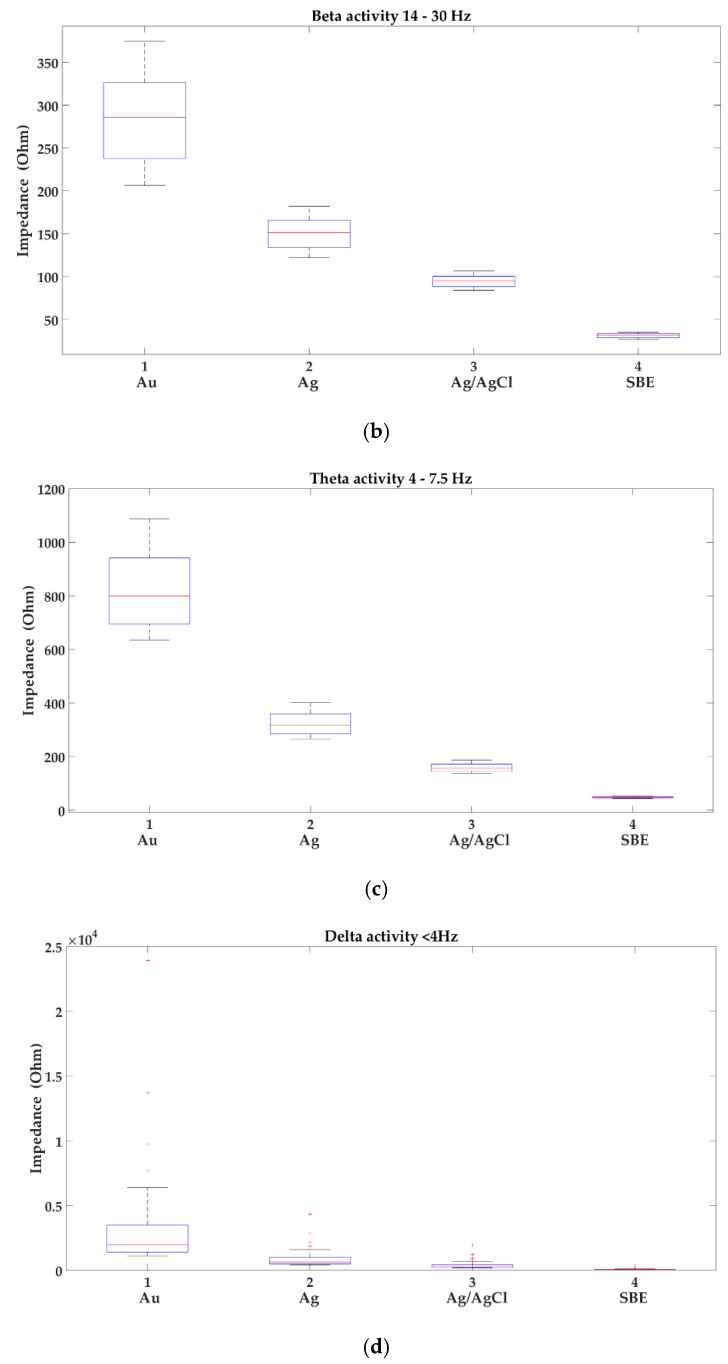
Figure 3.
Analysis of the variability of impedance of new electrodes in the following brain activities: (a) alpha 8–13 Hz; (b) beta 14–30 Hz; (c) theta 4–7.5 Hz; (d) delta 0.1–3.5 Hz; where: 1-gold (Au), 2-silver (Ag), 3-silver/silver chloride (Ag/AgCl) and 4-sintered bridge electrodes (SBE). Within the box, a horizontal red line means the median value of the data set, whereas the bottom and top blue lines of the box indicate the 25th and 75th percentiles, the whiskers present min and max, and the outliers are marked with the ‘+’ symbol.


