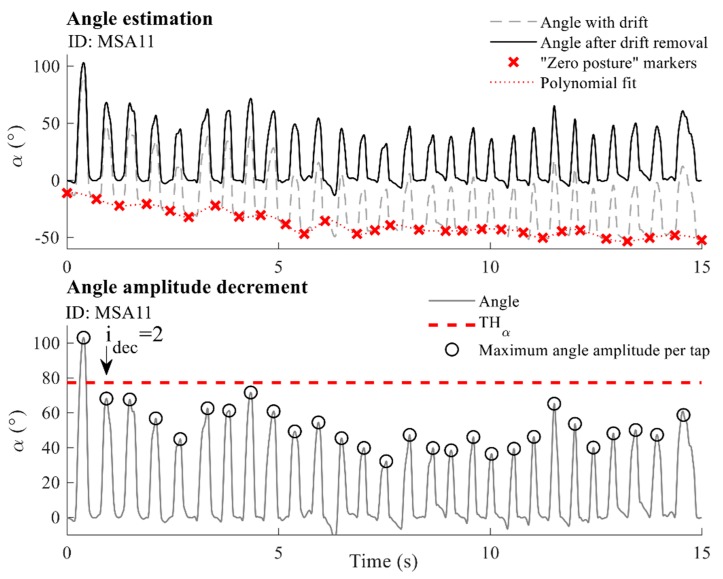
Figure 4.
Upper panel: Angle estimation. The dashed grey line marks the drifted angle sequence, and the solid black line corresponds to the angle sequence after drift removal. Red crosses show “zero posture” markers, and the dotted red line presents the polynomial fit used for drift removal. Lower panel: Angle amplitude decrement. The solid grey line shows the angle sequence, whereas black circles mark the angle amplitudes (highest finger apertures) per tap. The dashed red line presents the threshold used for the detection of decreased amplitudes. The example is given for one MSA patient (ID: MSA11).

