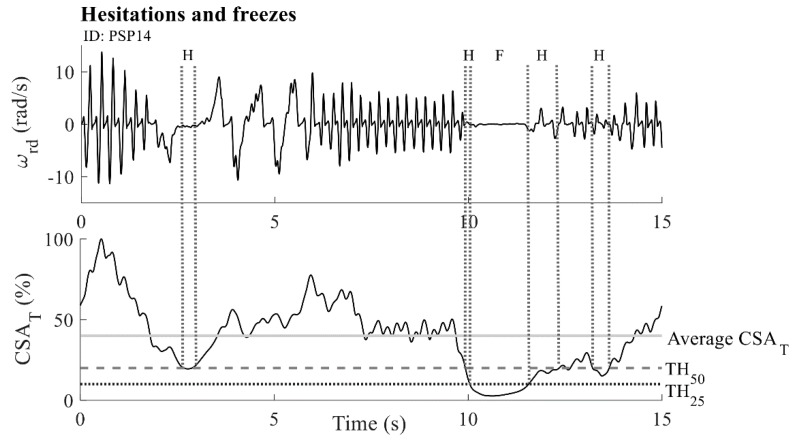
Figure 5.
Calculation of hesitations and freezes: angular velocity (upper panel) and calculated characteristic (bottom panel). The solid grey horizontal line marks the average value. The dashed grey horizontal line corresponds to the upper threshold of the average value. The dotted black horizontal line shows the lower threshold of the - average value. Similarly, dotted grey vertical lines show areas that are classified as hesitations (an “H” mark) and freezes (an “F” mark). The example is given for one PSP patient (ID: PSP14).

