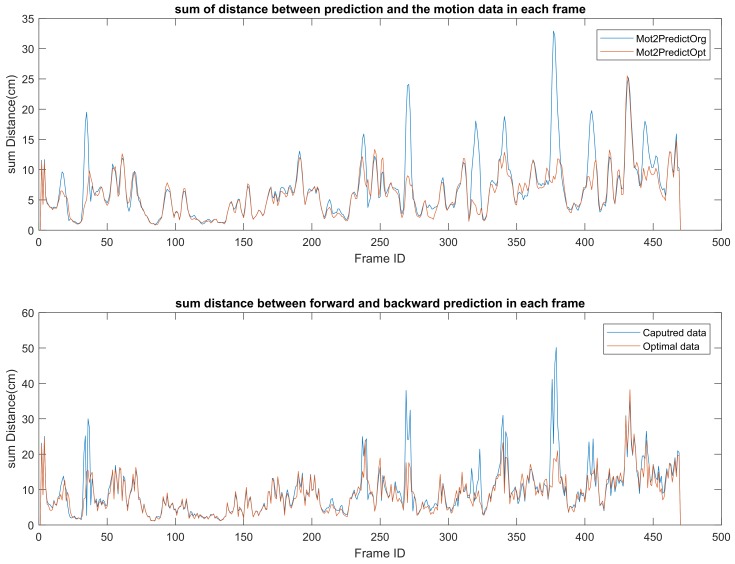
Figure 16.
Upper diagram: Summation of the distance between the forward and backward predicted joint positions in each frame. It shows how far the distance is between the estimated joint and the physical predicted position. Bottom diagram: Summation of the distance between joint position and predicted joint position in each frame. It illustrates the temporal symmetry of the motion. Blue: original captured data; Red: motion after optimization.

