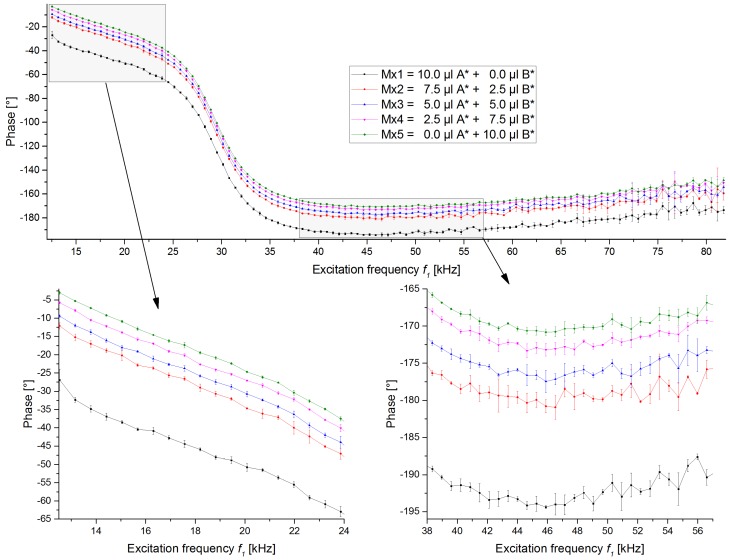
Figure 6.
Phase traces of excitation frequency scans using the same beads and bead solution concentrations as in Figure 5/Table 2, except that the bead solution for SynomagD (bead B) is not the original manufacturer stock solution but an already diluted one, to reduce the dominant effect of this bead in the measurement. The mean and standard deviation at each excitation frequency are shown.

