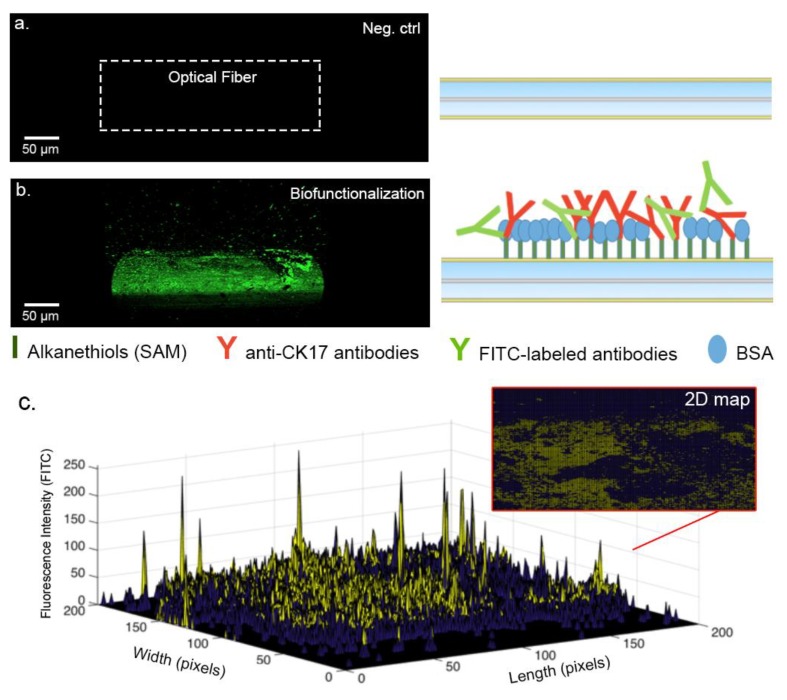
Figure 6.
Confocal microscopy analysis performed using fluorescein isothiocyanate (FITC)-labeled antibodies. (a) Scans performed with a gold-coated SMF28 optical fiber (no fluorescent antibodies). (b) Scan performed with a gold-coated optical fiber covered with the FITC-labeled antibodies and Bovine Serum Albumine (BSA)-blocked. (c) 3D map obtained by the fluorescence intensity, bringing approximations of the antibodies covered areas.

