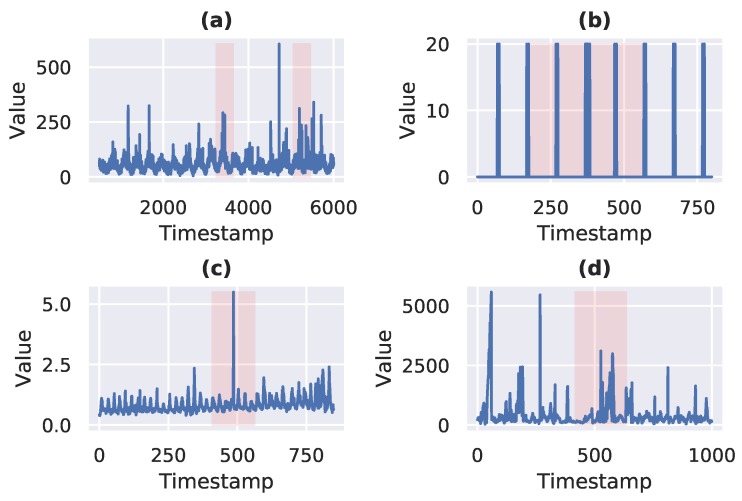
Figure 3.
(a) Real Tweets (Twitter_volume_AMZN), (b) Artificial With Anomaly (art _increase_spike_density); (c) Real Ad Exchange (exchange-3_cpm_results); (d) Real Traffic (TravelTime_451_whole). Snippets of Numenta Anomaly Benchmark (NAB) time-series from different domains are plotted. Actual time-series are shown in blue, whereas the highlighted area shows an anomaly window.

