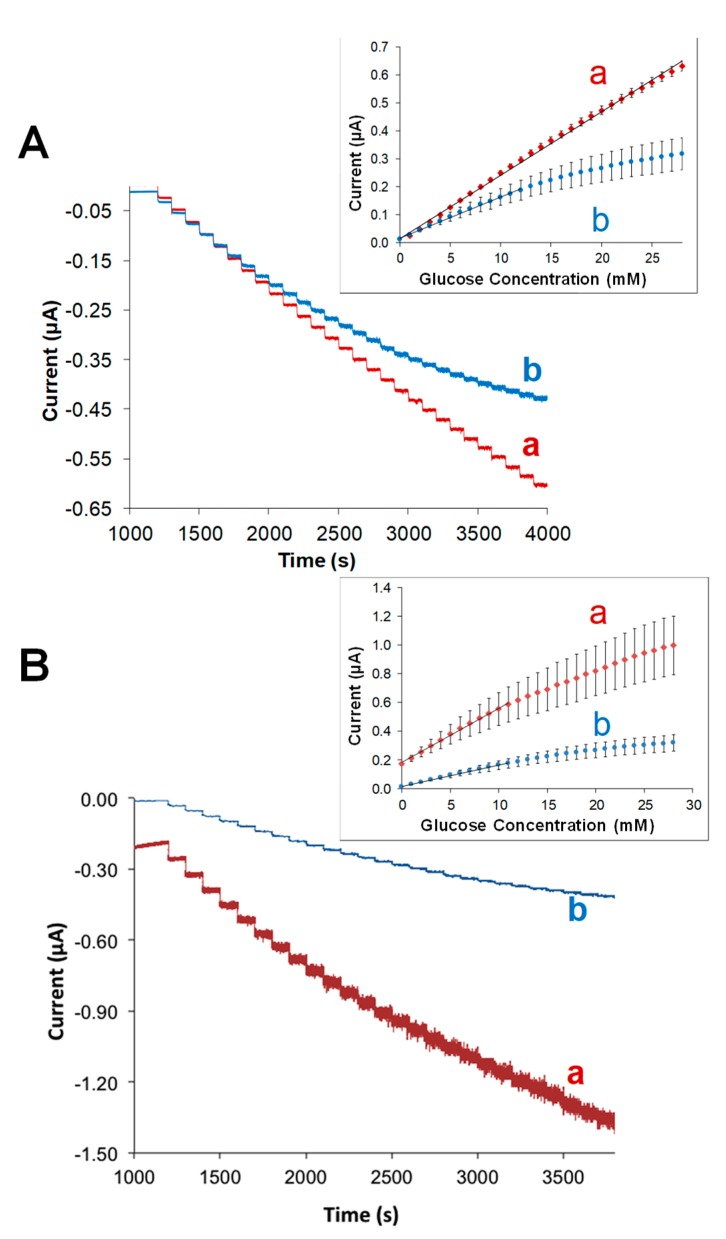
Figure 8.
Amperometric I-t curves and corresponding calibration curves (insets) during successive 1 mM injections of glucose at (A) Pt macroelectrodes (a) vs. Pt-Ir wire electrodes (b) each modified with GOx-doped OTMS xerogel, undoped OTMS xerogel, polyphenol (PP), and polyurethane layer (PU) tested in synthetic urine; (B) The same LbL system at Pt-Ir wire electrodes (a) with and (b) without Pt-black underlayer and tested in synthetic urine. Note: Error bars represent standard error (n ≥ 3).

