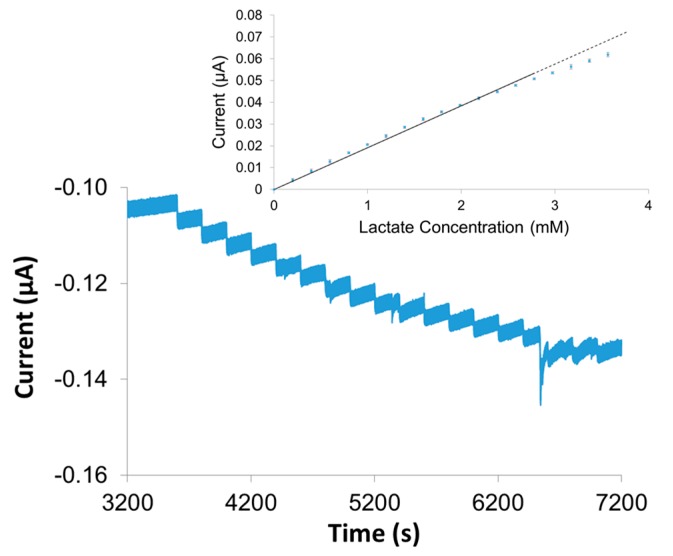
Figure 9.
Typical amperometric I-t curve and corresponding calibration curve during successive 0.2 mM injections of lactate at Pt-Ir wire modified with electrochemically-deposited pyrrole layer, LOx and BSA-doped HMTES xerogel, polyurethane layer (100% PU) capping layer, and epoxy cap tested in blood serum. Notes: Amperometric responses have been normalized to compensate for rising background charging current; error bars represent standard deviation of the mean (n ≥ 3).

