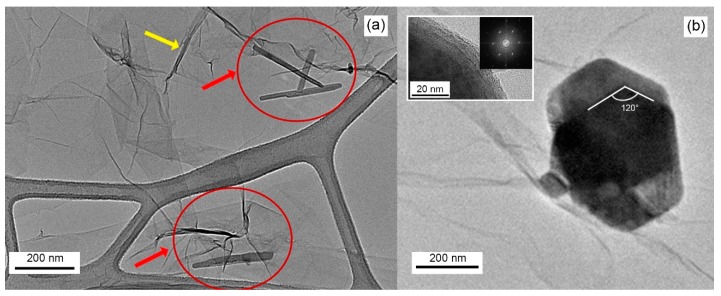
Figure 2.
High-resolution TEM of WS2-decorated rGO showing: (a) light-grey background of interconnected GO flakes. Darker grey lines (yellow arrow) corresponding to folded GO edges and some WS2 flakes vertically placed on GO flakes (needless inside the red circle); (b) a big hexagonal WS2 flake. The inset shows a magnification of the flake’s edges with related SAED analysis pattern.

