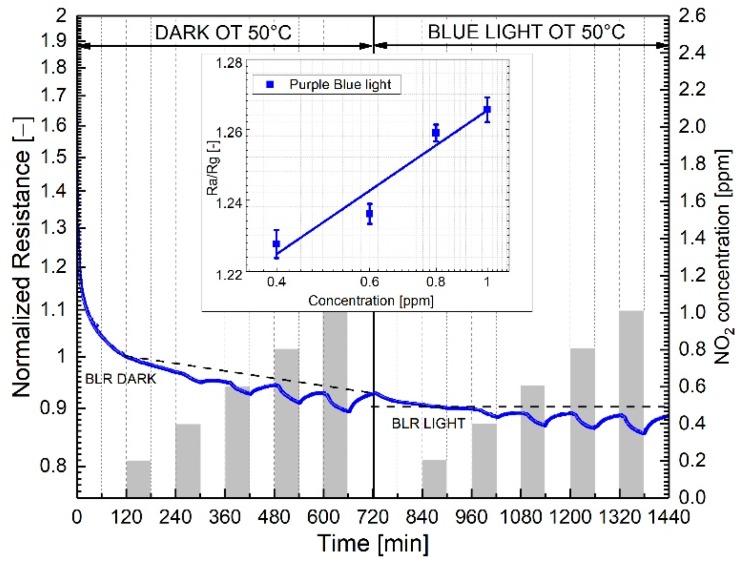
Figure 8.
Comparison of WS2-decorated rGO’s electrical responses to increasing NO2 concentrations at 50 °C operating temperature under dark and light conditions respectively. The inset shows the sensitivity plot corresponding to light conditions. The bars in the inset represent the standard deviation calculated over a set of five measurements performed for each gas concentration. Dotted lines indicate the baseline resistance in dry air.

