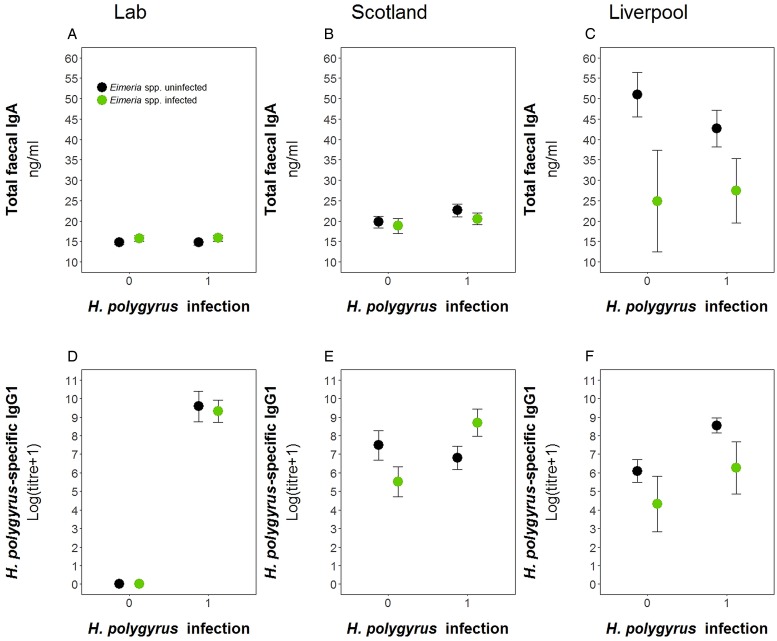
Fig. 6.
Comparison of antibody levels between laboratory and field studies. Top row, total fecal IgA; bottom row, H. polygyrus-specific IgG1. (A) and (D) represent the laboratory experiment, (B) and € represent the Scotland field study, and (D) and (F) represent the Liverpool field study. Data is split by H. polygyrus infection (x-axis) and E. hungaryensis (or Eimeria spp.) infection (green dots) or E. hungaryensis (or Eimeria spp.) uninfected (black dots). Points represent means ± s.e.

