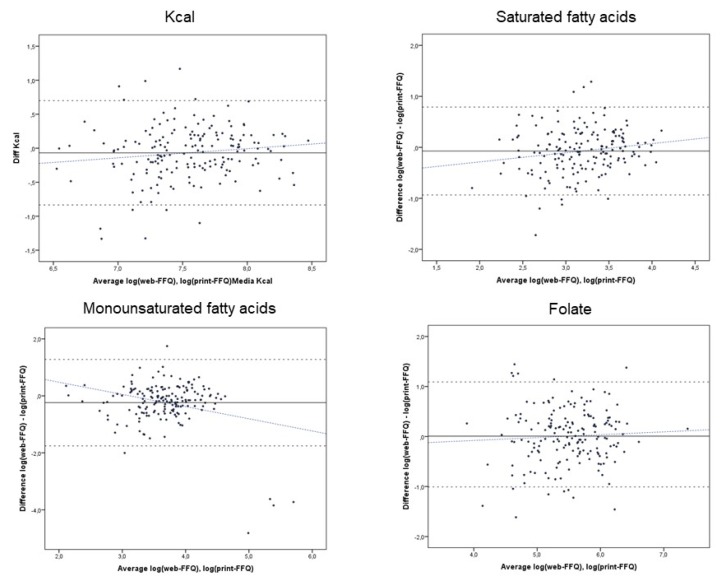
Figure 2.
Bland–Altman plots of individual differences in nutrient intakes (total energy intake, saturated fatty acids, monounsaturated fatty acids and folate) between the web-FFQ and print-FFQ against their averages; the upper and lower 95% limits of agreement (dashed lines), mean agreement (solid line) and regression slope (blue dashed line) are indicated.

