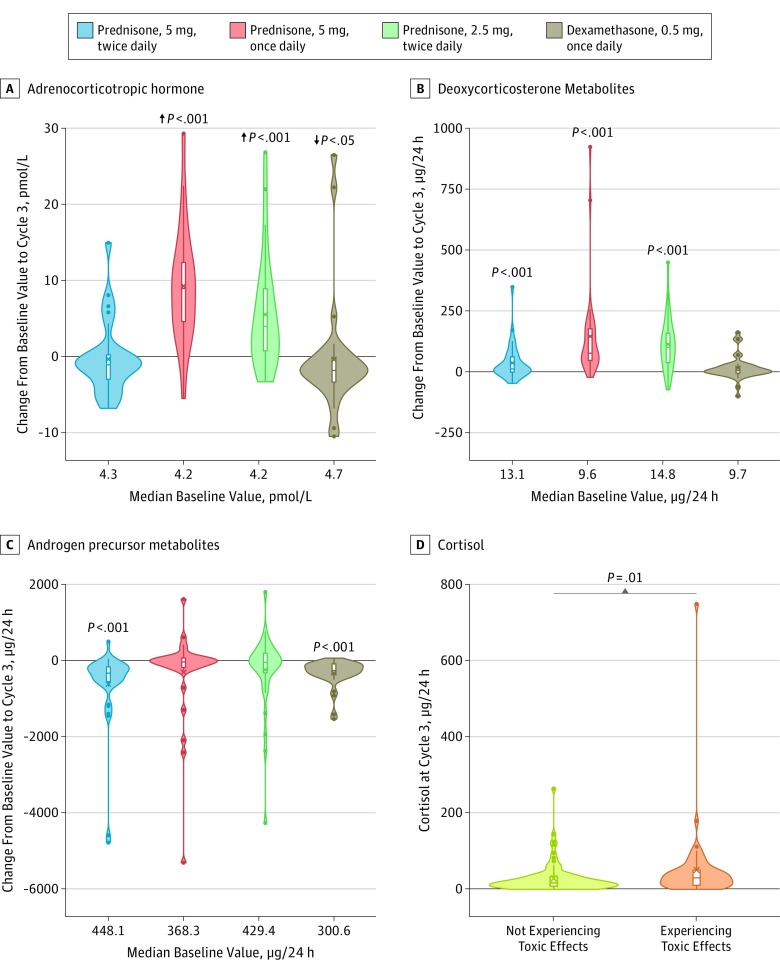
Figure 2. Changes From Baseline to Cycle 3 in the 4 Treatment Arms and the Association With Toxic Effects of Sum of Metabolites of Cortisol at Cycle 3.
Violin plots show the changes in plasma adrenocorticotropic hormone (A), urinary deoxycorticosterone metabolites (B), and urinary sum of androgen precursor metabolites (C). Boxes represent the median (horizontal bar), mean (X), and quartiles 1 (Q1) and 3 (Q3) (lower and upper end of boxes). The whiskers indicate quartiles ±1.5 × (Q3-Q1). Minimum and maximum values are the lowest and highest dots. Significant changes from baseline, as determined by the Wilcoxon signed rank test, are noted in panels A to C. A, Arrows represent a significant decrease in the adrenocorticotropic hormone level in the dexamethasone group vs significant increases in the groups treated with prednisone, 5 mg, once daily or prednisone, 2.5 mg, twice daily. D, Significant differences in the level of metabolites of cortisol between patients experiencing or not experiencing clinical mineralocorticoid toxic effects (eg, grade ≥2 hypertension, grade ≥ 1 hypokalemia) in the first 24 weeks of treatment, as determined by the Wilcoxon 2-sample test.

