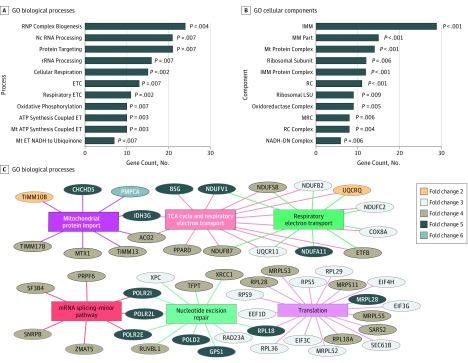
Figure 2. Gene Ontology (GO) and Reactome Pathway Enrichment Analysis of the Differentially Expressed Genes in Human Nasal Epithelium Exposed to Thirdhand Smoke.
Bar charts show the most highly enriched biological process (A) and cellular component (B) GO terms. Each bar represents the number of genes identified in our study that are associated with each process or component. All biological processes and cellular components identified had an adjusted P value for multiple testing less than .05. C, Network plot shows the top 6 enriched pathways and the associated genes using Reactome pathway analysis. Also shown are the approximate fold change values of each gene. The colored lines show the link between the genes and pathways identified. ATP indicates adenosine triphosphate; ET, electron transport; ETC, electron transport chain; IMM, mitochondrial inner membrane; LSU, large subunit; MM, mitochondrial membrane; MRC, mitochondrial respiratory chain; mRNA, messenger RNA; Mt, mitochondria; NADH-DN, nicotinamide adenine dinucleotide dehydrogenase complex; Nc, noncoding RNA; RC, respiratory chain; RNP, ribonucleoprotein; rRNA, ribosomal RNA; and TCA, trichloroacetic acid cycle.

