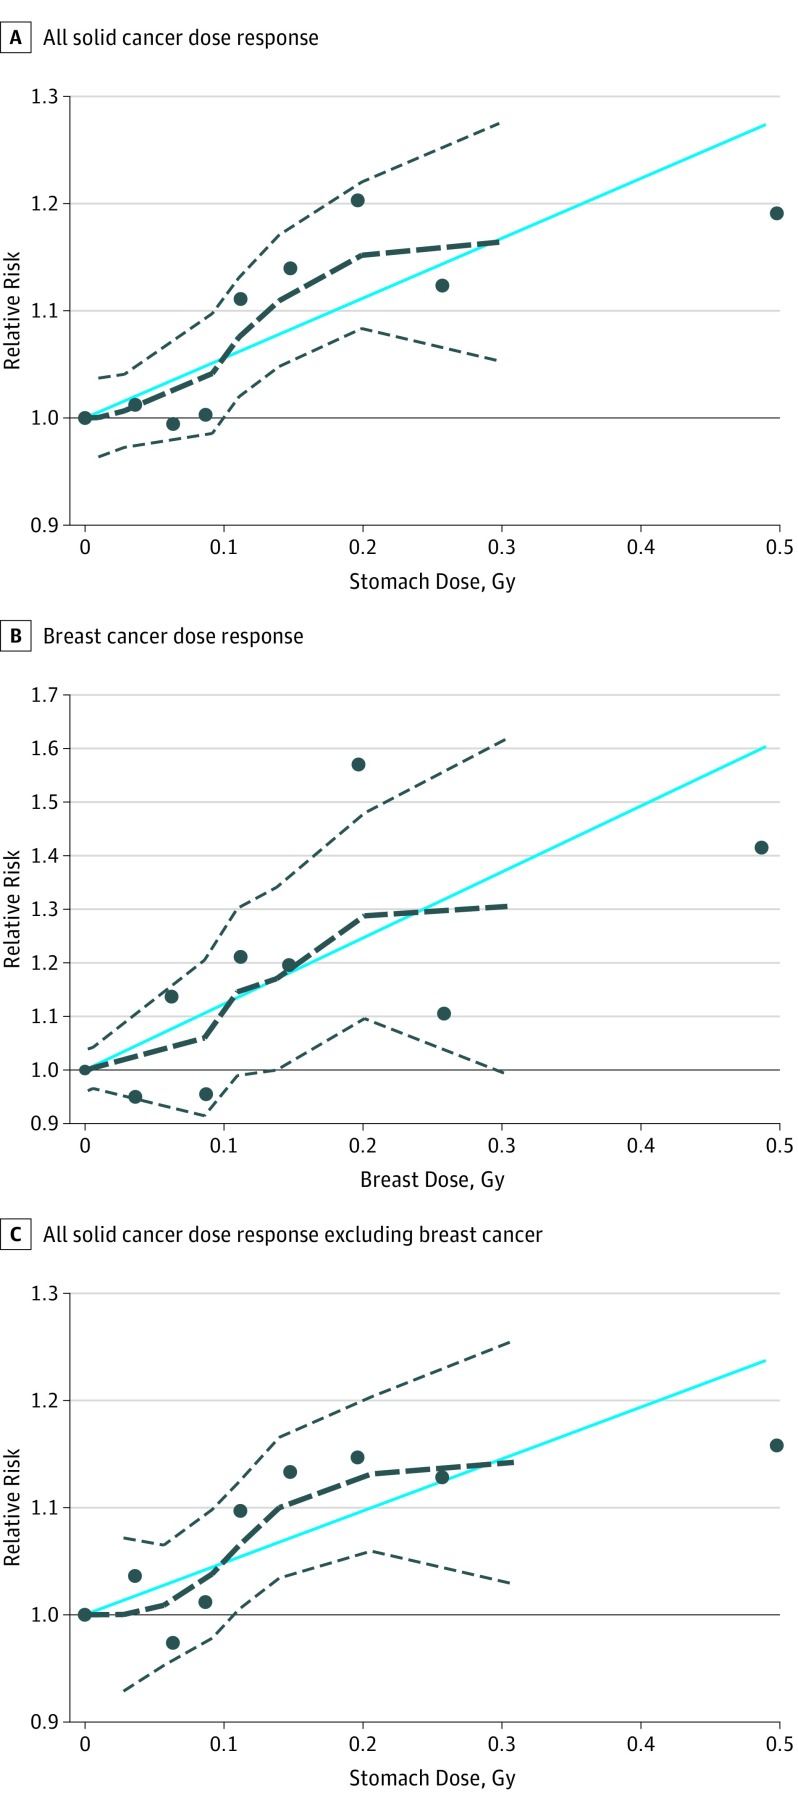
Figure. Relative Risks for Solid Cancer, Female Breast Cancer, and Solid Cancer Without Female Breast Cancer Mortality Among Patients With Hyperthyroidism .
Patients were cancer free at the time of radioactive iodine (RAI) treatment. Relative risks were compared across organ- or tissue-absorbed dose (in grays [to convert to the conventional unit rad, multiply by 100]). Solid horizontal lines represent the relative risk reference value (1). Solid blue lines represent the estimated log-linear dose-response relationships. Dashed black lines represent the smoothed dose-response relationships, and dashed gray lines represent 95% CIs. Black dots represent the relative risk at each organ dose category. Background rates include terms for sex, sex-specific attained age and birth cohort patterns, Graves disease diagnosis, additional treatment with surgical procedure, and additional treatment with antithyroid drugs.

