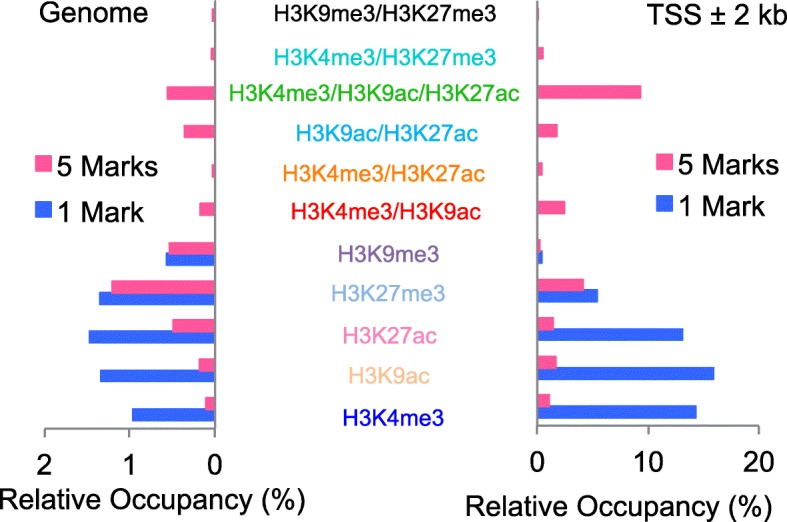
Fig. 2.

Distributions of single-nucleosome histone modification signals in the genome
Relative occupancy of histone modification signals in each nucleosome with individual marks (1 Mark) and with combined marks (5 Marks) of five histone marks together in the whole genome and within ±2 kb of the TSS of genes in HepG2 cells
