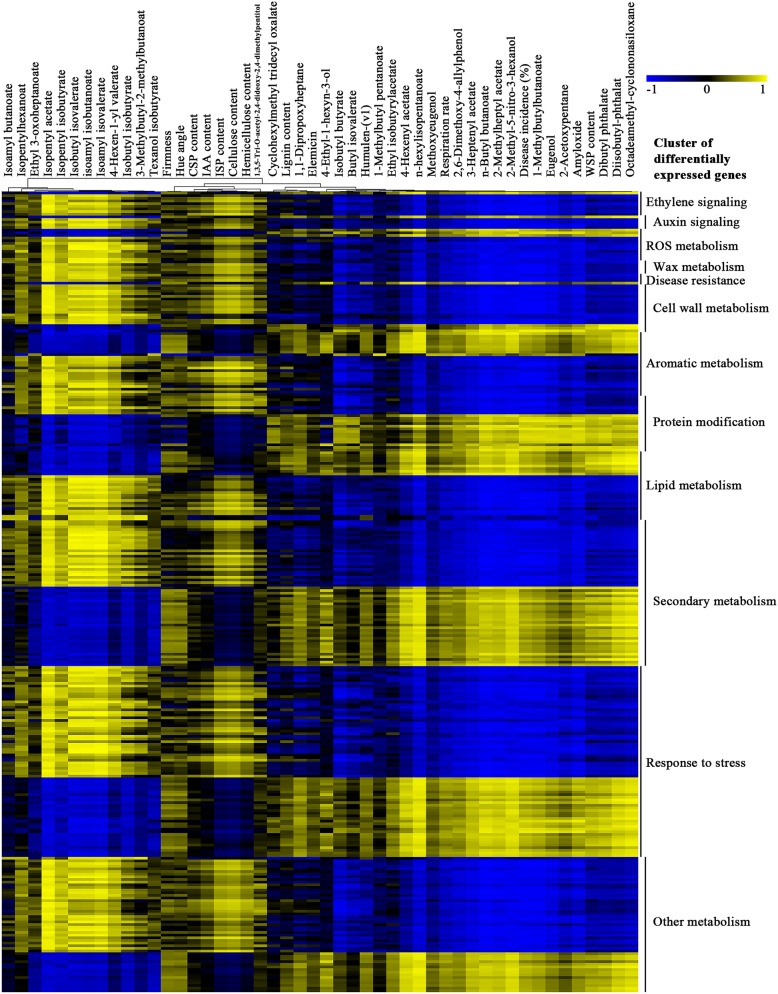
Fig. 8.
Heat map showing the correlation analysis between differentially expressed genes and fruit physiological characteristics of banana peel after melatonin treatment. A total of 302 significant (p < 0.05) expressed genes and 48 physiological characteristics were used for correlation matrix analysis. The correlation coefficient (positive or negative) is represented by virtual color as indicated in the color key

