Fig. 3.
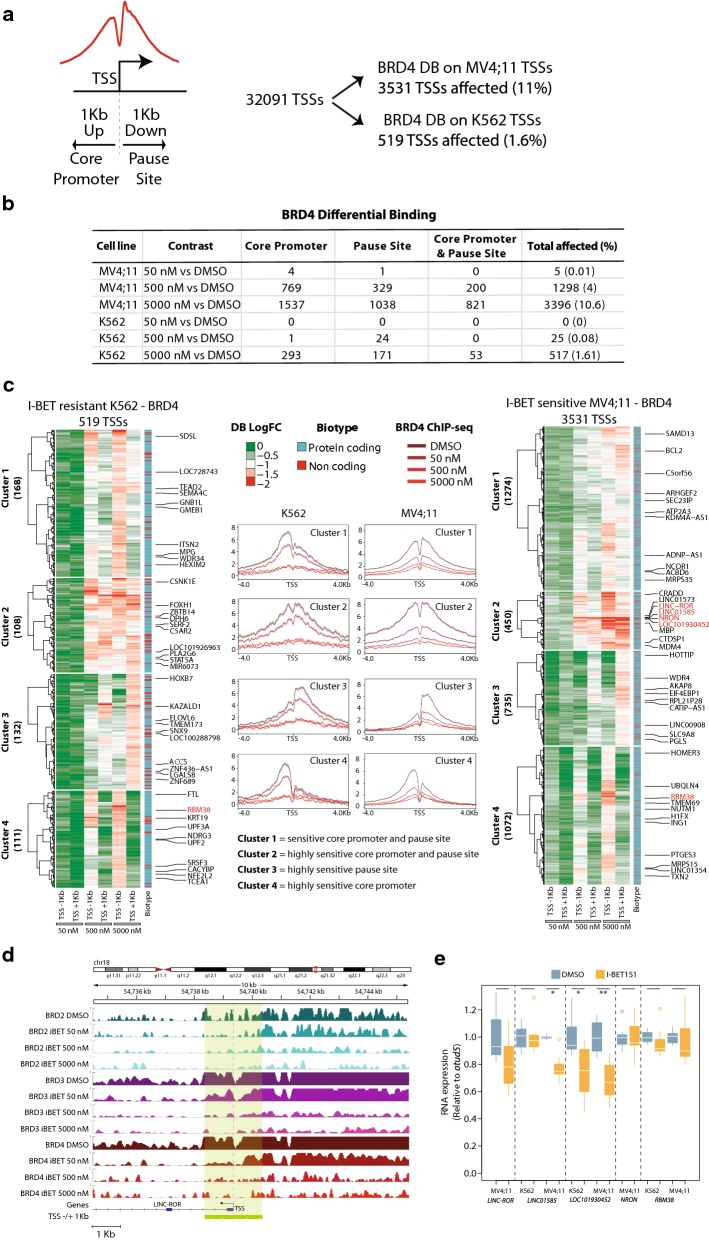
BRD4 displacement at TSSs correlates with cell sensitivity. a Representation of a TSS and the surrounding − 1 Kb (core promoter) and + 1 Kb (pause site) used for the DB analysis. Right panel shows the count of total TSSs and the number (and percentage) of TSSs affected (at − 1 Kb or + 1 Kb or both) in MV4;11 and K562. b Table containing TSS counts for significant cases of DB at core promoter and pause site or both. The “Total affected” column contains the number (and percentage) of TSSs affected at any of the two sites. c Hierarchical clustering of ChIP signal (log2 fold change or LFC) for TSSs (rows) with DB in − 1 Kb or + 1 Kb as defined above. For each of the three treatment conditions (50 nM, 500 nM or 5000 nM), LFC of signal at TSS − 1 Kb and TSS + 1 Kb (columns) in K562 (left, total of 519 TSSs with DB) and MV4;11 (right, total of 3531 TSSs with DB) are shown (“Materials and methods” section). In each cluster, a random set of genes is shown in addition to the 5 most sensitive genes in Cluster 2 showing differential binding at 50 nM I-BET in MV4;11 (in red) in addition to BCL2 in Cluster 1. The category of each gene (protein coding or non-coding) is represented under the biotype column on the right to each heatmap. All four non-coding RNAs with a BRD4 DB at 50 nM I-BET151 in MV4;11 fall in cluster 2 for MV4;11 cells. For the K562 DB-based clustering (left panel heatmap), only the protein coding gene RBM38 showed a significant decrease in binding. The middle panel represents metagene profiles of BRD4 ChIP-seq data for the corresponding clusters. Inferred names to the identified clusters are indicated below the metagene profiles. d Genome browser visualization of the LINC-ROR locus showing the strong decrease in ChIP signal for all BET proteins, and specifically BRD4, when treated with 50 nM I-BET151. Note the marked decrease at TSS + 1 Kb (pause site). The green line and gray shadowed box depict the TSS −/+ 1 Kb area. The scale is shown in the lower left corner. e RNA expression profiling by RT-qPCR on the five genes showing DB in MV4;11 cells at 50 nM of I-BET151. The expression value of each transcript is referred to the expression of a reference gene (OTUD5), and the mean of the DMSO for each comparison group is set to 1. Stars represent level of significance with (*) for p -value < 0.05, and (**) for p value < 0.005. Only cases with detectable expression are shown

