Fig. 6.

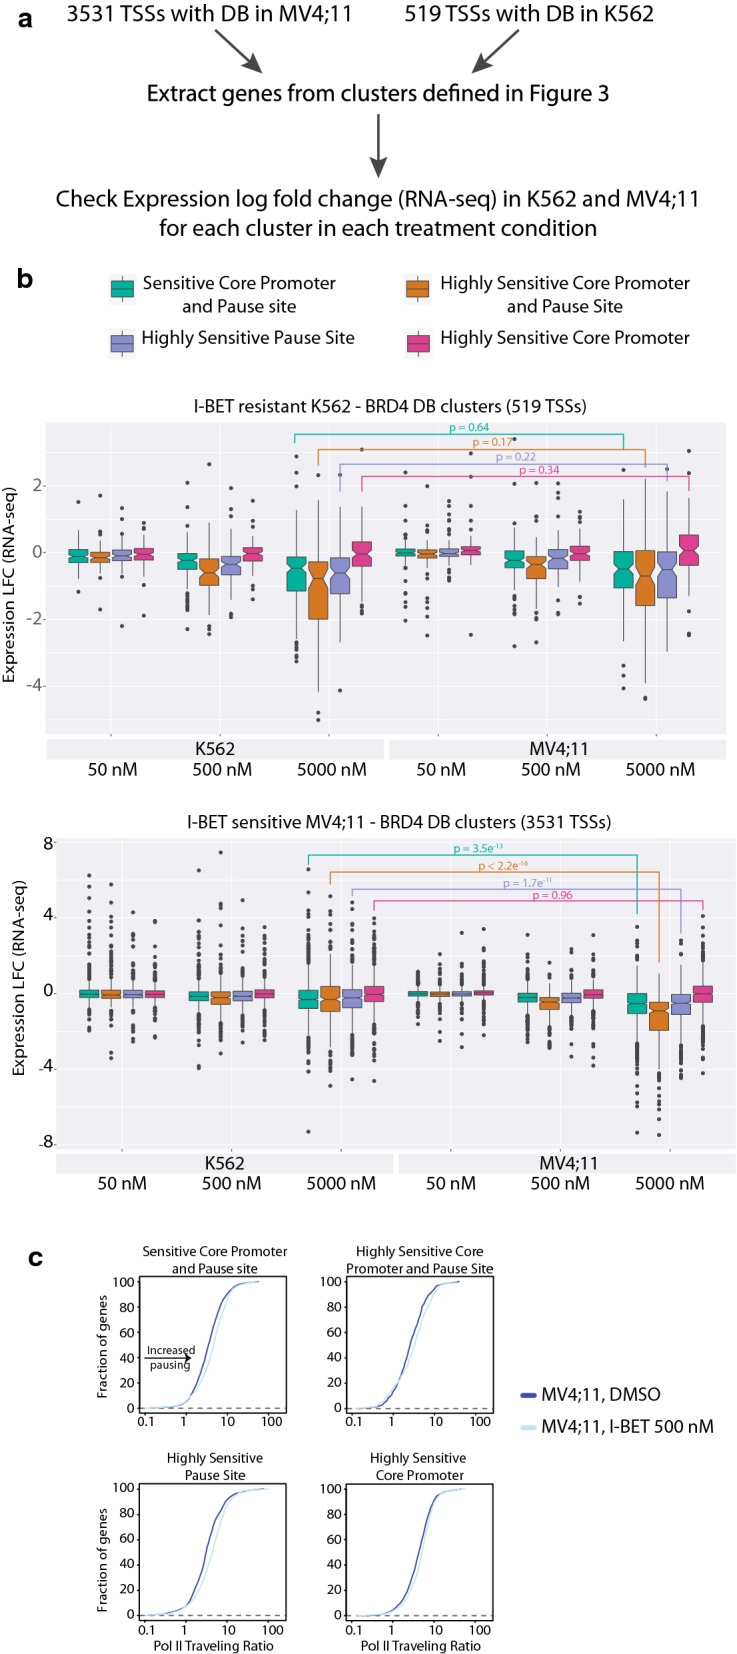
Gene expression changes correlate with a significant loss of BRD4 binding at − 1 Kb and with increase in Pol II pausing. a Schematic representation of the analysis performed to correlate the signature of DB with DE. b Boxplots for RNA-seq log2 fold changes for each cluster identified in Fig. 3c as a function of cell type and condition: upper panel for K562-based clustering and lower panel for MV4;11-based clustering. P values correspond to Wilcoxon signed-rank test. c Traveling ratio (TR) based on Pol II ChIP-seq in MV4;11 cells: Each panel represents TR of genes belonging to clusters defined in Fig. 3c in DMSO condition (blue) and in response to 500 nM I-BET treatment (light blue)
