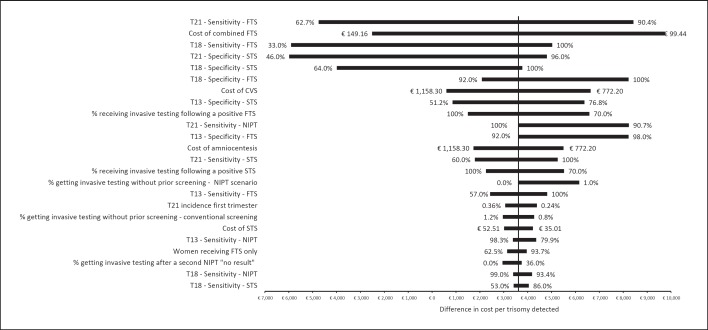
Fig. 3.
Graph displaying the outcomes of the one-way sensitivity analysis, with a ranking of model inputs having the greatest impact on model results. Model inputs are along the vertical axis. The model outcome, difference in cost per trisomy detected between conventional screening and NIPT, is displayed on the horizontal axis. The bar labels show the range in model inputs, while the bar displays the associated range in outcome. Thus, wider bars indicate that the model input range has a greater impact on model results. CVS, chorionic villus sampling; FTS, first-trimester screening; NIPT, noninvasive prenatal testing; STS, second-trimester screening.

