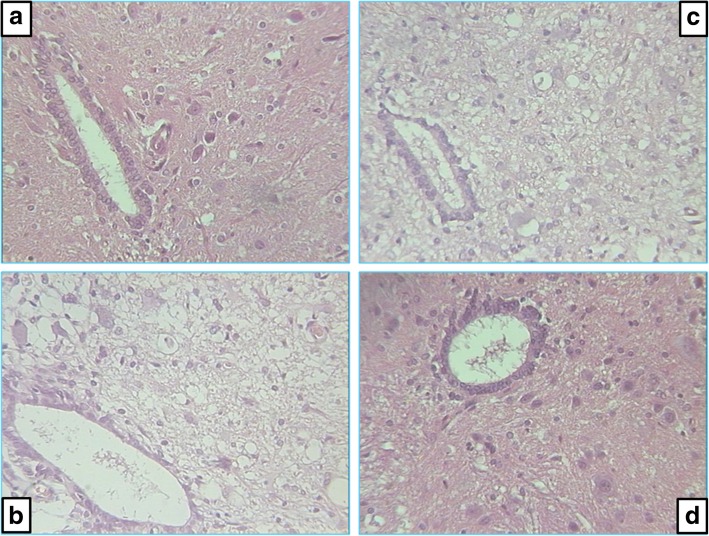
Fig. 5.
Microscopic presentation of posttraumatic spinal cord changes in the intermediate gray matter at the lesion site. a Ten min after injury, all animals have no difference compared to healthy animals. b–d Histology 30 days after injury: b control animals, huge edema and loss of neurons; c BPC 157 2 μg/kg, minimal edema changes and occasionally loss of neurons; d BPC 157 200 μg/kg, no difference to healthy animal. Staining H&E, magnification × 300

