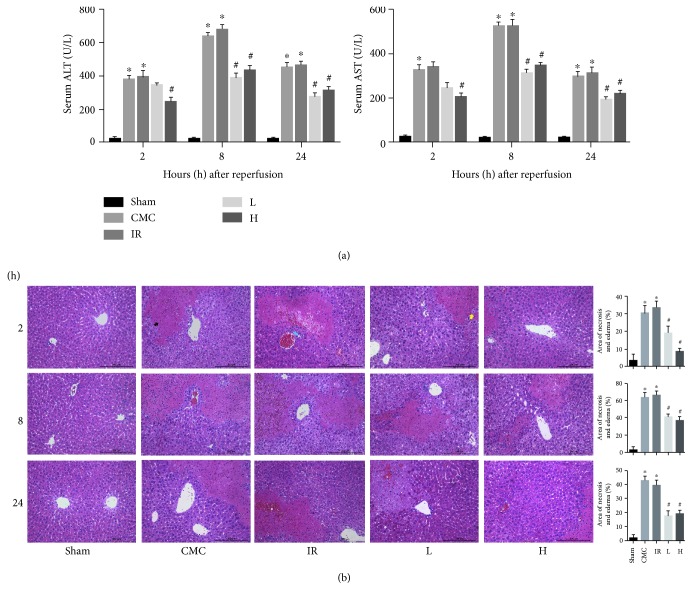
Figure 1.
OA preconditioning alleviates hepatic IRI biochemically and histopathologically. (a) Serum ALT and AST levels at 2, 8, and 24 h after hepatic IR detected by ELISA. (b) H&E staining of the liver specimens collected at three time points. Scale bar: 200 μm. The black arrow indicates the necrotic area, the yellow arrow represents edema, and the blue arrow indicates leukocyte infiltration. The areas of necrosis and edema were quantified with Image-Pro Plus 6.0 (original magnification, ×200). Data are presented as mean ± standard error (n = 6, ∗P < 0.05 versus sham, #P < 0.05 versus IR).

