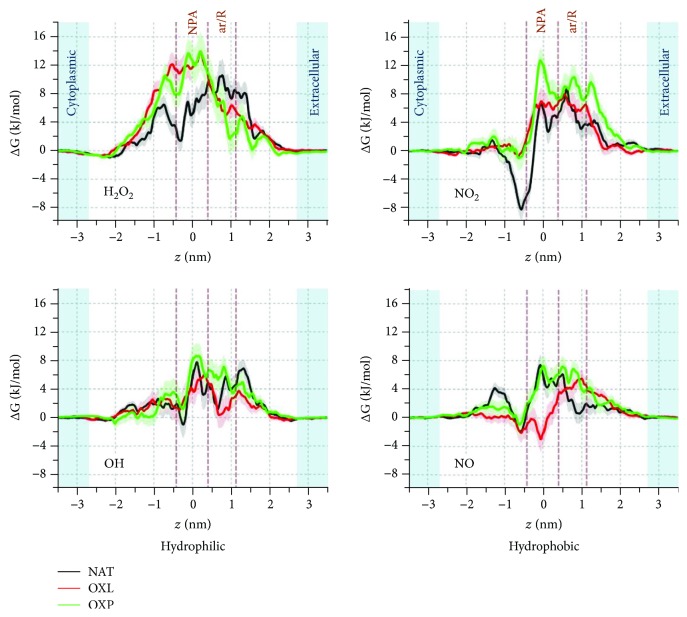
Figure 2.
Average FEPs of the hydrophilic (H2O2 and OH) and hydrophobic (NO2 and NO) RONS across AQP1 pores of the native (NAT, black curve) and oxidized (OXL and OXP, red and green curves) model systems. The extracellular and cytoplasmic aqueous phases are shown in light blue color. The uncertainties in the profiles are represented in pale color. The NPA and ar/R regions are indicated by the brown dashed lines, and z = 0 nm is set to the NPA region. The same designation of the NPA and ar/R regions applies to the other similar figures below.

