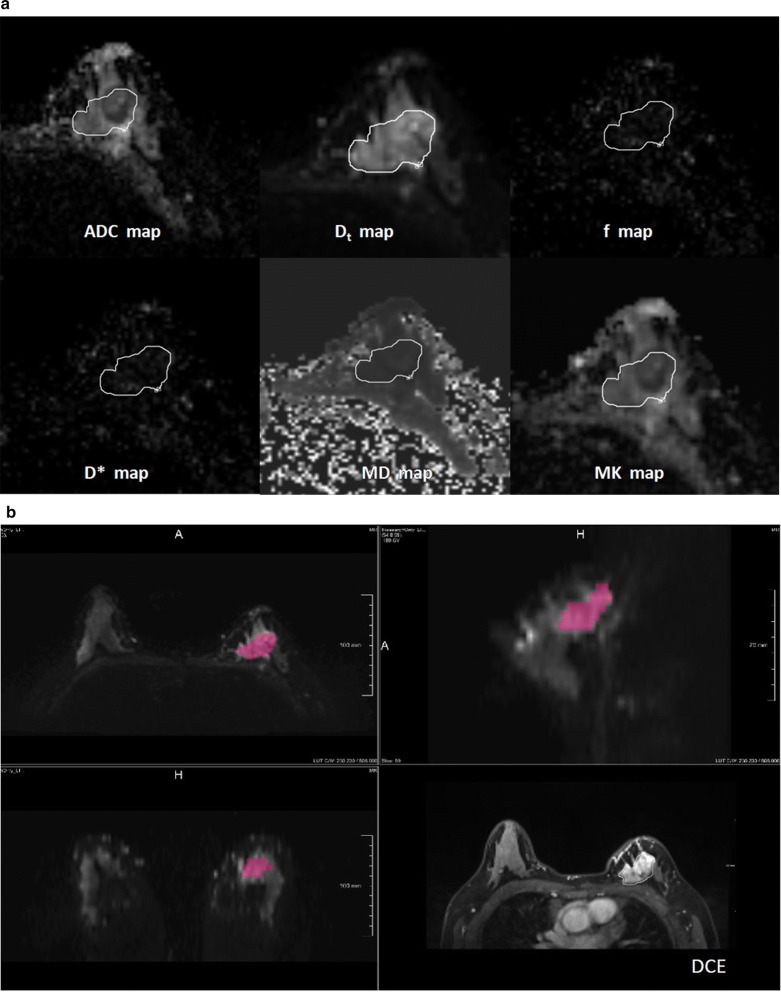
Fig. 1.
Workflow for the histogram analysis. a Foreground seed points were manually drawn on the axial view of the original ADC map (b value = 1000 s/mm2), and on the multiparametric diffusion parameter maps within the same ROI. b The 3D segmentation was created on the three multiplane reconstruction planes, and DCE images were accessed to verify the lesion boundaries

