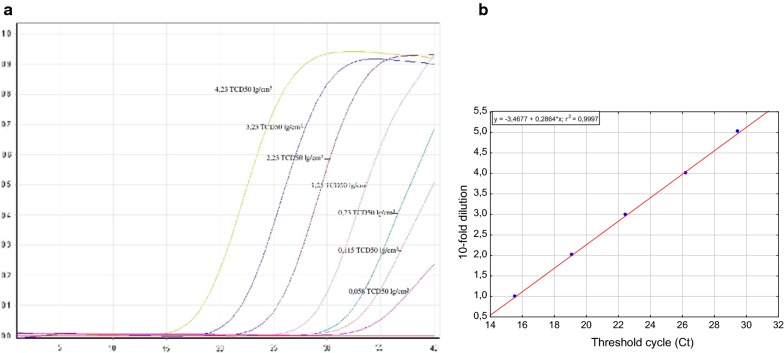
Fig. 2.
a Amplification curves obtained over five orders of magnitude. From the left to the right, the curves represent five tenfold serial dilutions (performed in triplicates) and three twofold dilutions (performed in 20 replicates), from 4.23 to 0.025 lg TCD50/mL, of DNA. b Linearity of the PCR assay results over five orders of magnitude. The equation of the standard curve obtained was y = − 3.4677 + 0.2864*x, and the determination coefficient r2 was 0.9997. Reactions of the no-template controls tested showed no Ct values (data not shown)

