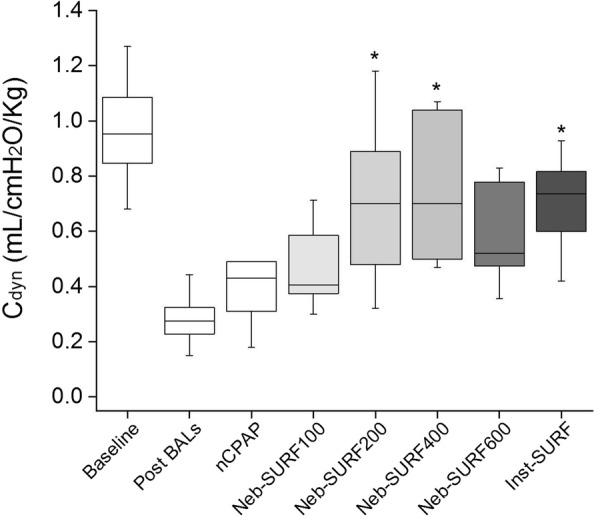
Fig. 4.

Box-plots showing dynamic compliance (Cdyn) at baseline (from all animals), after inducing a respiratory distress (Post BALs, from all animals) and 180 min after treatment with just nasal continuous positive pressure ventilation (nCPAP), with different doses of nebulized surfactant (Neb-SURF100, Neb-SURF200, Neb-SURF400, and Neb-SURF600) or with intratracheal surfactant (Inst-SURF). The boxes encompass the 25–75 percentiles. The horizontal line within the boxes represents the median. The whiskers indicate the maximum and minimum values observed for each group. The whiskers indicate the maximum and minimum values observed for each group. * P vs. nCPAP < 0.05
