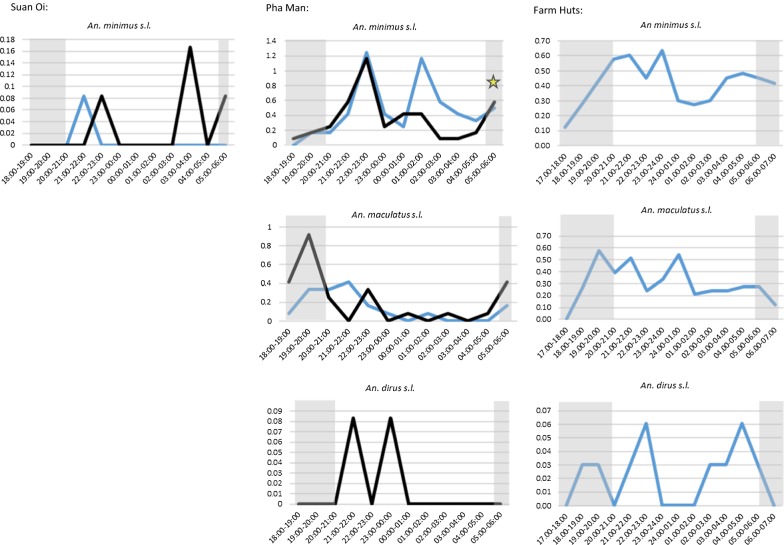
Fig. 6.
Hourly biting profiles of primary vector species captured by HLC. Plots show hourly biting rates of primary vector species caught by IHLC (blue line) and OHLC (black line) in three capture sites: Suan Oi village (left-hand column); Pha Man hamlet (middle) and Farm huts (right-hand column). Yellow star represents where a Plasmodium-positive sample was captured. Shaded grey area is time outside of median sleeping hours reported by adults in the cross-sectional survey

