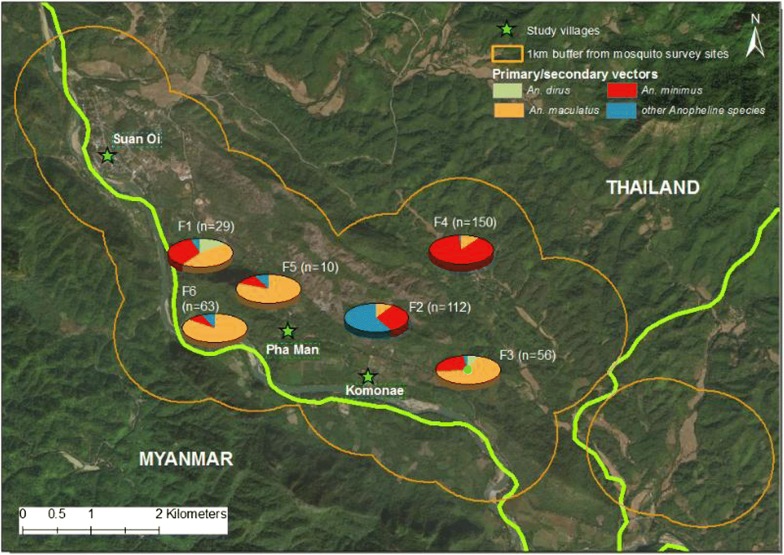
Fig. 7.
Map showing abundance and species composition in each of the forested farm hut collection sites. Pie charts each represent the location of one of the six forested farm hut collection sites, denoted F1–F6. Total number of anophelines captured in each location is shown in brackets while pie charts show the breakdown by species. Orange line represents a 1 km buffer zone around the six sites. Green stars show each study village and green line is the international border between Thailand and Myanmar

