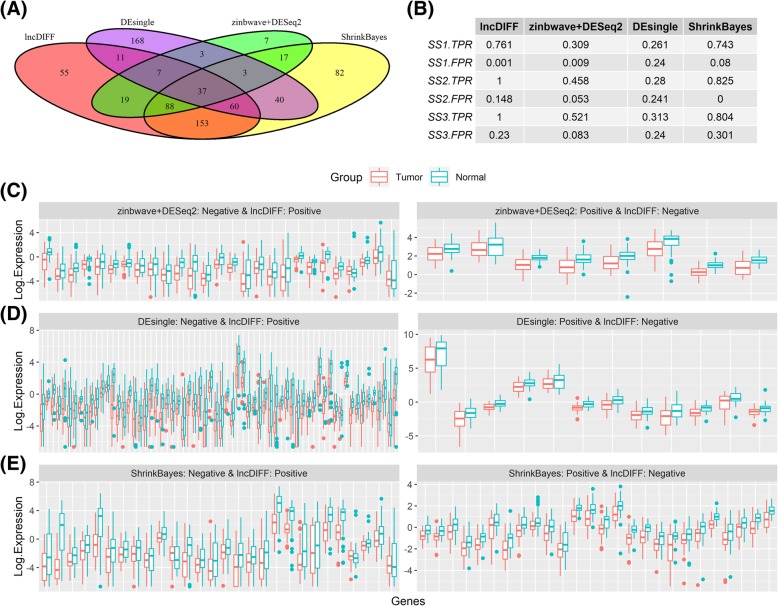
Fig. 3.
Performance of lncDIFF, zinbwave+DESeq2, DEsingle and ShrinkBayes on TCGA HNSC matched tumor-normal samples. (A) Venn diagram for DE genes identified by each method. (B) TPR and FPR for each method based on surrogate DE gene sets SS1-SS3 defined by log2 fold change > 0.5, 1.0, 1.5. (C)-(E) Boxplots for tumor vs. normal log2 RPKM of genes detected as positive by one method and negative by another

