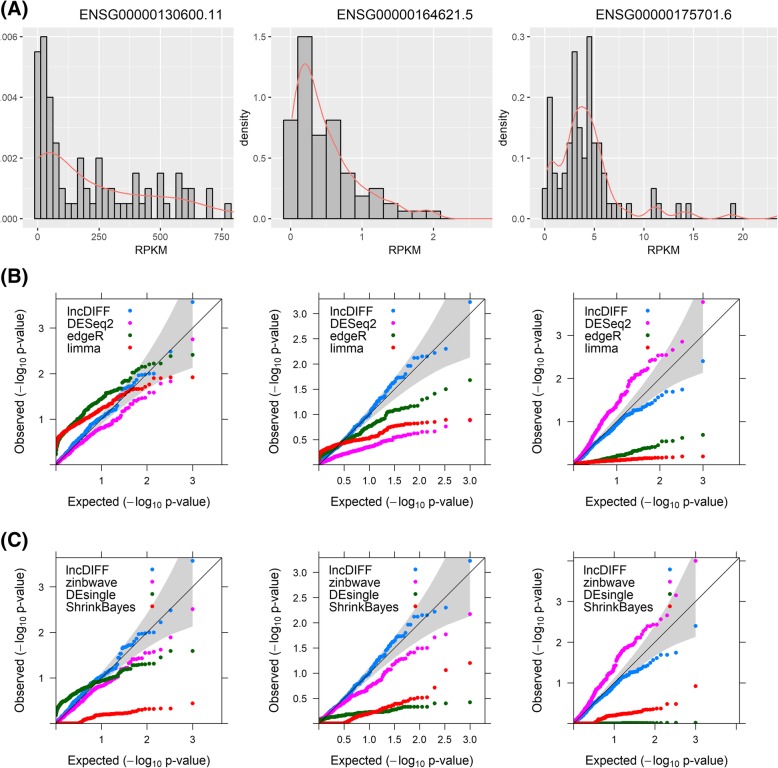
Fig. 4.
QQ plots of simulated null p-values for genes in TCGA HNSC study. (A) Histogram and density plot of RPKM for each genes. (B) Corresponding QQ plot of null p-values simulated by shuffling the samples for lncDIFF, DESeq2, edgeR and limma. (C) Corresponding QQ plot of null p-values simulated by shuffling the samples for lncDIFF, zinbwave+DESeq2, DEsingle and ShrinkBayes

