Fig. 1.
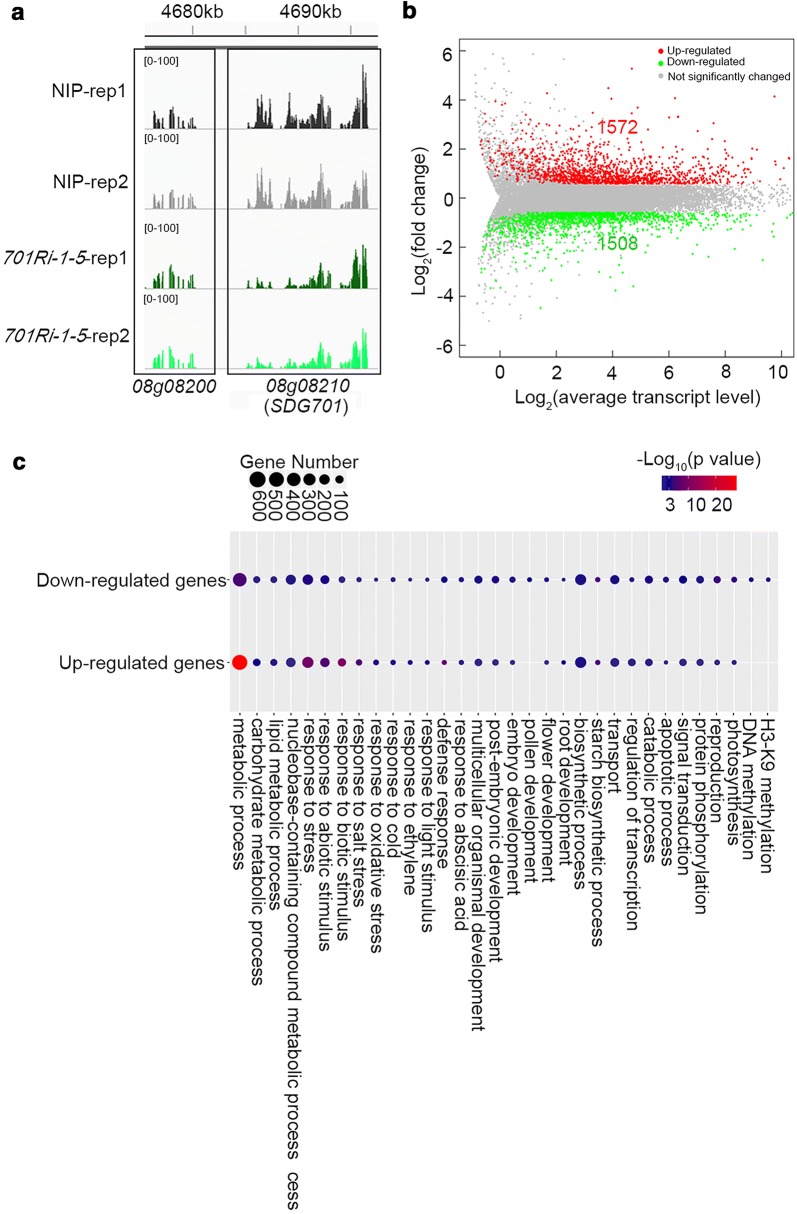
Transcriptome analysis of the SDG701 knockdown mutant. a IGV screen shots presenting the normalized read densities of LOC_Os08g08210 (SDG701) and LOC_Os08g08200 (gene neighboring SDG701) based on an RNA-sequencing analysis of two biological replicates of the wild-type NIP and 701Ri-1-5 mutant plants. b MA plot presenting gene transcription changes following the knockdown of SDG701. Green and red points represent the genes exhibiting down- and up-regulated expression (> 1.5-fold change), respectively, whereas the gray points represent the genes with unchanged expression, in the 701Ri-1-5 mutant compared with the wild-type NIP. The adjusted p value (p.adj) was calculated with the Benjamini–Hochberg correction. c Functional enrichment analysis of genes with significantly down- or up-regulated expression levels. The size of each point represents the number of genes, and p values are indicated with various colors

