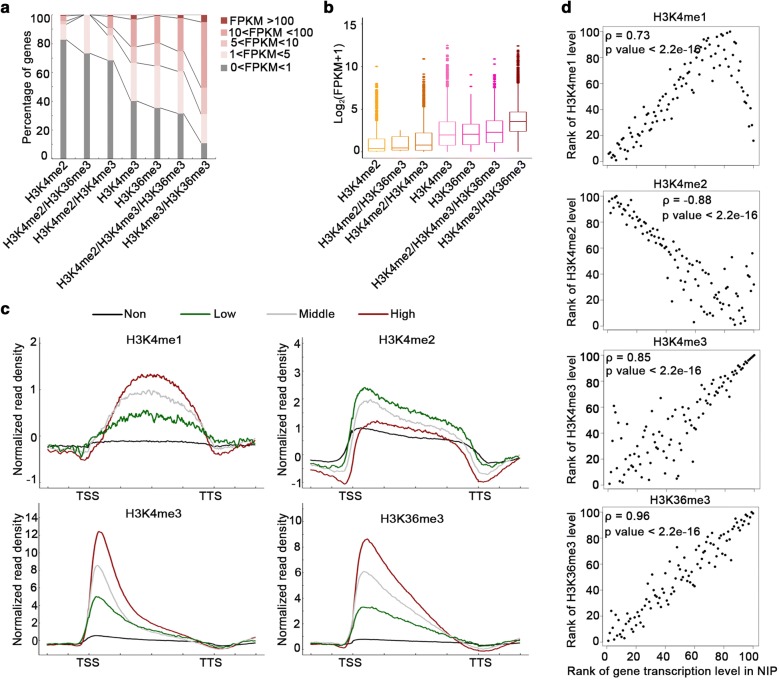
Fig. 3.
H3K4me2 level is negatively correlated with the gene transcription level in rice. a Genes marked by H3K4me2 only, H3K4me3 only, H3K36me3 only, H3K4me2 and H3K4me3, H3K4me2 and H3K36me3, or H3K4me2, H3K4me3, and H3K36me3 exhibited varying transcription levels in the wild-type NIP. Genes categorized by transcription levels (FPKM values) are distinguished by different colors. b Box plots presenting the transcription levels of the genes with a differentially marked H3 in (a) (p < 0.001 according to the Wilcoxon test). c Average density plots presenting the H3K4me1/H3K4me2/H3K4me3 and H3K36me3 distribution patterns along the differentially expressed genes in the wild-type NIP. The plots were generated from 1 kb upstream of the TSS to 1 kb downstream of the TTS. The annotated rice genes were grouped based on transcription levels. Non: not expressed, 0 < FPKM < 1 (black); Low: low expression level, 1 < FPKM < 2 (green); Middle: moderate expression level, 2 < FPKM < 10 (gray); and High: high expression level, FPKM > 10 (red). d Scatter plots presenting the relationship between H3K4me1/H3K4me2/H3K4me3 and H3K36me3 levels and gene transcription levels in the wild-type NIP. The H3K4me1/H3K4me2/H3K4me3 and H3K36me3 (from the TSS to the TTS) levels were calculated as follows: ChIP-seq normalized read density−input normalized read density for expressed genes (FPKM > 1). Spearman’s rank correlation coefficient indicates the correlation between the methylation level and the gene expression level. The p value was determined based on Spearman’s rank correlation test

