Fig. 4.
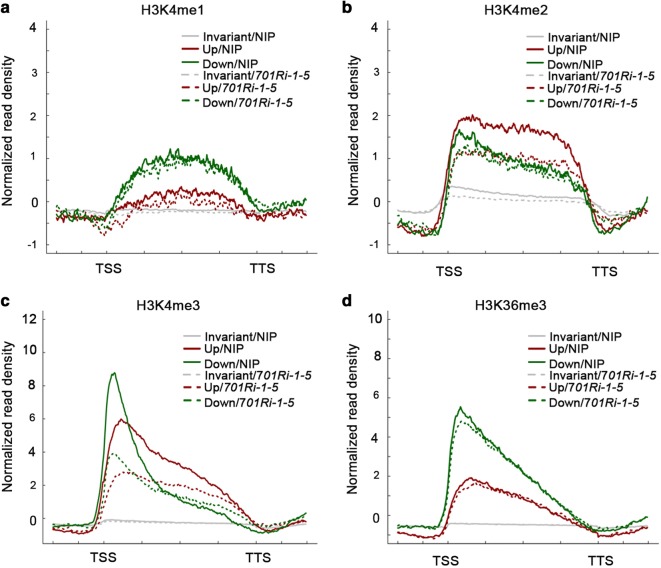
Genes exhibiting up-regulated expression in the 701Ri-1-5 mutant have decreased H3K4me2 levels. a–d Average density plots presenting the H3K4me1/H3K4me2/H3K4me3 and H3K36me3 distribution patterns along genes exhibiting significantly up-regulated expression (up: 1572 genes with expression levels > 1.5-fold higher in the 701Ri-1-5 mutant than in the wild-type NIP), down-regulated expression (down: 1508 genes with expression levels > 1.5-fold lower in the 701Ri-1-5 mutant than in the wild-type NIP), and no significant changes (Invariant) in the NIP (solid line) and 701Ri-1-5 mutant (dashed line) samples. The plots were generated from 1 kb upstream of the TSS to 1 kb downstream of the TTS

