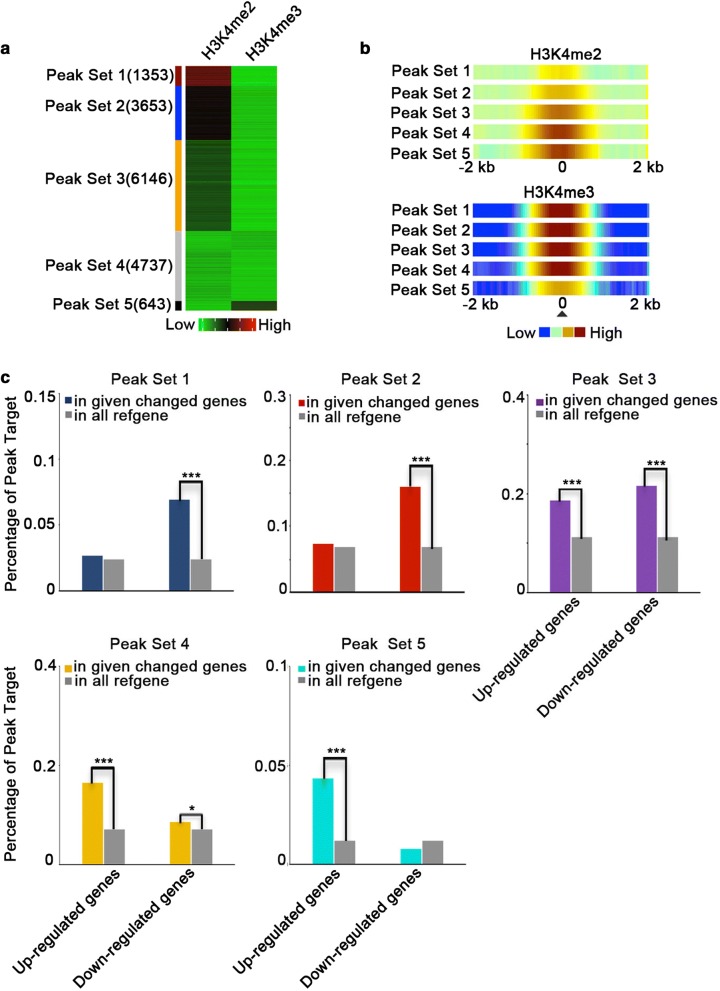
Fig. 5.
Decreases in H3K4me2 and H3K4me3 levels result in up- and down-regulated gene expression, respectively. a Heatmap for five sets of peaks based on the difference in the H3K4me2/H3K4me3 levels between the 701Ri-1-5 mutant and the wild-type NIP. Significant changes to H3K4me2 and H3K4me3 peaks were based on an FDR value < 1e−4 and > 1.5-fold change (701Ri-1-5/NIP ≤ 1.5). Green, black, and red represent the peaks with decreased, unchanged, and increased H3K4me2 and H3K4me3 levels in the 701Ri-1-5 mutant relative to the levels in the wild-type NIP, respectively. b Visualization of the average normalized read intensity profile close to the H3K4me2/H3K4me3 peak center (marked as 0) for each peak set in wild-type NIP. c Enrichment analysis of the target genes of Peak Set 1–5 among the genes exhibiting up- or down-regulated expression in the 701Ri-1-5 mutant. ***p < 1e−4 and *p < 0.05 according to Fishers’ exact test

