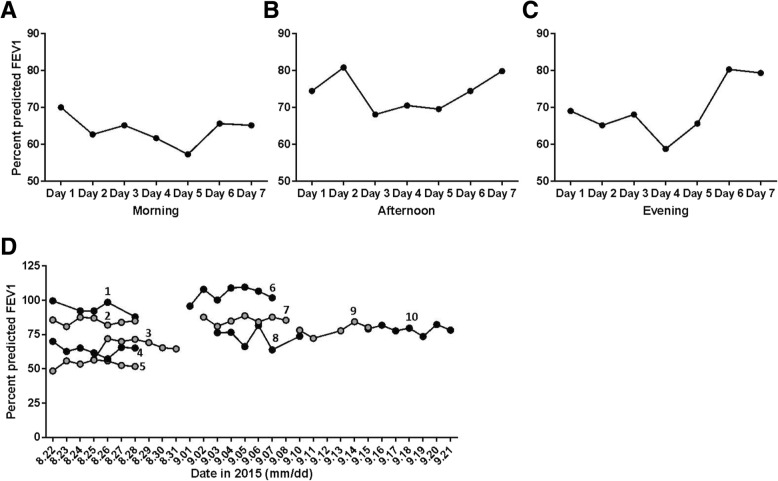
Fig. 6.
Percent predicted FEV1. Data for an ELF participant is shown across the seven day study period in the a morning, b afternoon and c evening. d Percent predicted FEV1 values from morning spirometry readings are shown for all ten study participants. Values are marked numerically [1–10] to delineate individual results

