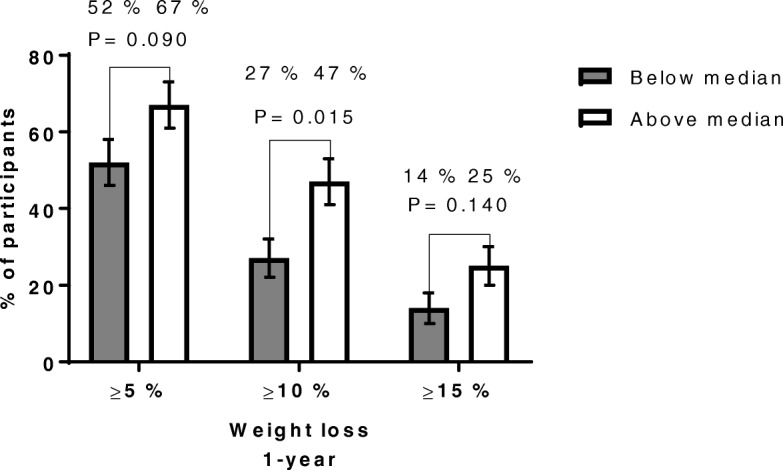
Fig. 4.

Proportions of patients in the two groups, who achieved median 3-month percentage increases in CRF, who at 1-year follow-up achieved at least 5, 10% or 15% weight loss. Data are presented as percentage of participants with standard error of the mean (SEM), either above or below median 3-month percentage increases in CRF, who achieved at least 5, 10% or 15% weight loss at 1-year follow-up. 3-month percentage increases in CRF above median, N = 72. 3-month percentage increases in CRF below median, N = 71. In the above median CRF group, the number of patients who achieved at least 5, 10% or 15% was 48 (67%, SEM 6%), 34 (47%, SEM 6%), 18 (25, 5%), respectively. In the below median CRF group, the number of patients who achieved at least 5, 10% or 15% was 37 (52%, SEM 6%), 19 (27%, SEM 5%), 10 (14%, SEM 4%), respectively
