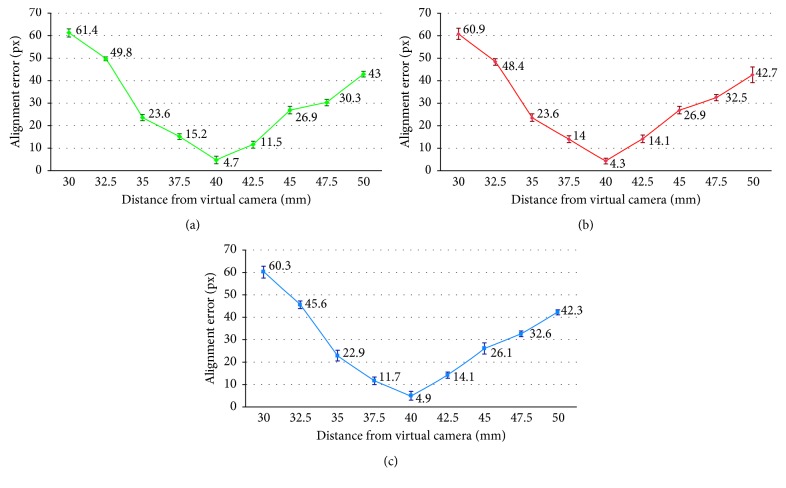
Figure 12.
Error trend as the distance from the virtual camera varies. The error bars are expressed as twice the standard deviation. The number of samples varies in relation to the number of corners that can be identified in the images, and it is included in the range 32–56. Alignment error cameras: (a) 1-2, (b) 2-3, and (c) 1–3.

