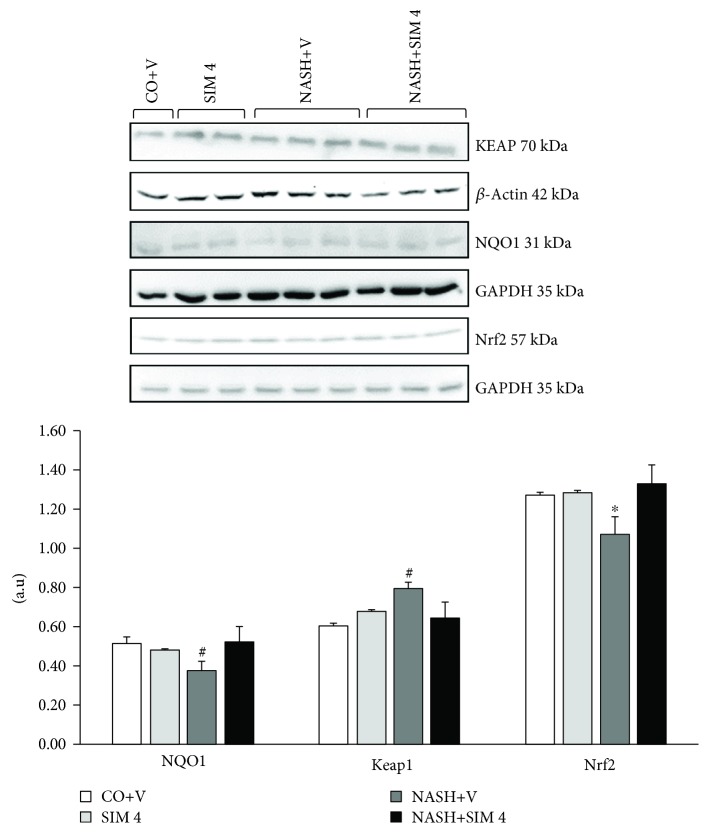
Figure 2.
Effect of a MCD diet and treatment with simvastatin on NQO1, Keap1, and Nrf2 protein by Western blot analysis. The data are expressed as the mean ± standard deviation (S.D.). #P < 0.01 versus CO+V, SIM 4, and NASH+V. ∗P < 0.05 versus CO+V, SIM 4, and NASH+V. CO+V: control plus vehicle; SIM 4: control plus simvastatin 4 mg/kg; NASH+V: NASH plus vehicle; NASH+SIM 4: NASH plus simvastatin 4 mg/kg.

