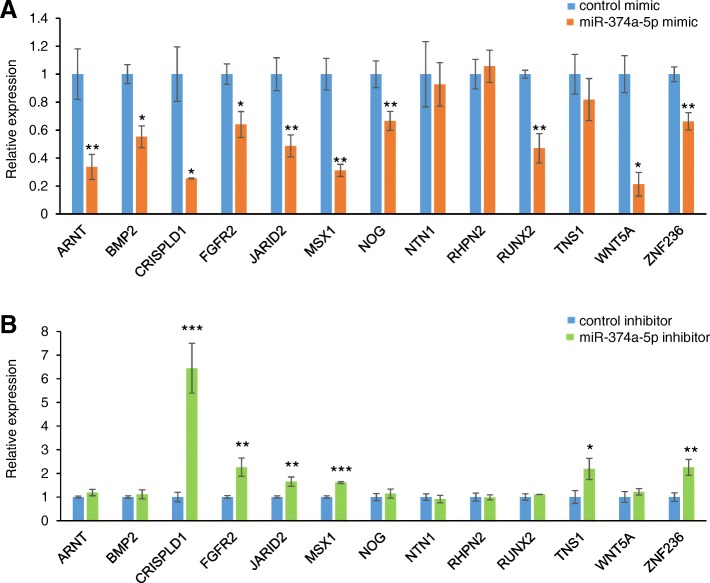
Fig. 4.
Effect of miR-374a-5p on predicted target genes. a Quantitative RT-PCR for the indicated genes after treatment with negative control (light blue) or miR-374a-5p mimic (orange). * p < 0.05, ** p < 0.01, *** p < 0.001. Each treatment group was compared with the control. n = 6 per group. b Quantitative RT-PCR for the indicated genes after treatment with negative control (light blue) or miR-374a-5p inhibitor (light green). * p < 0.05, ** p < 0.01, *** p < 0.001. Each treatment group was compared with the control. n = 6 per group

