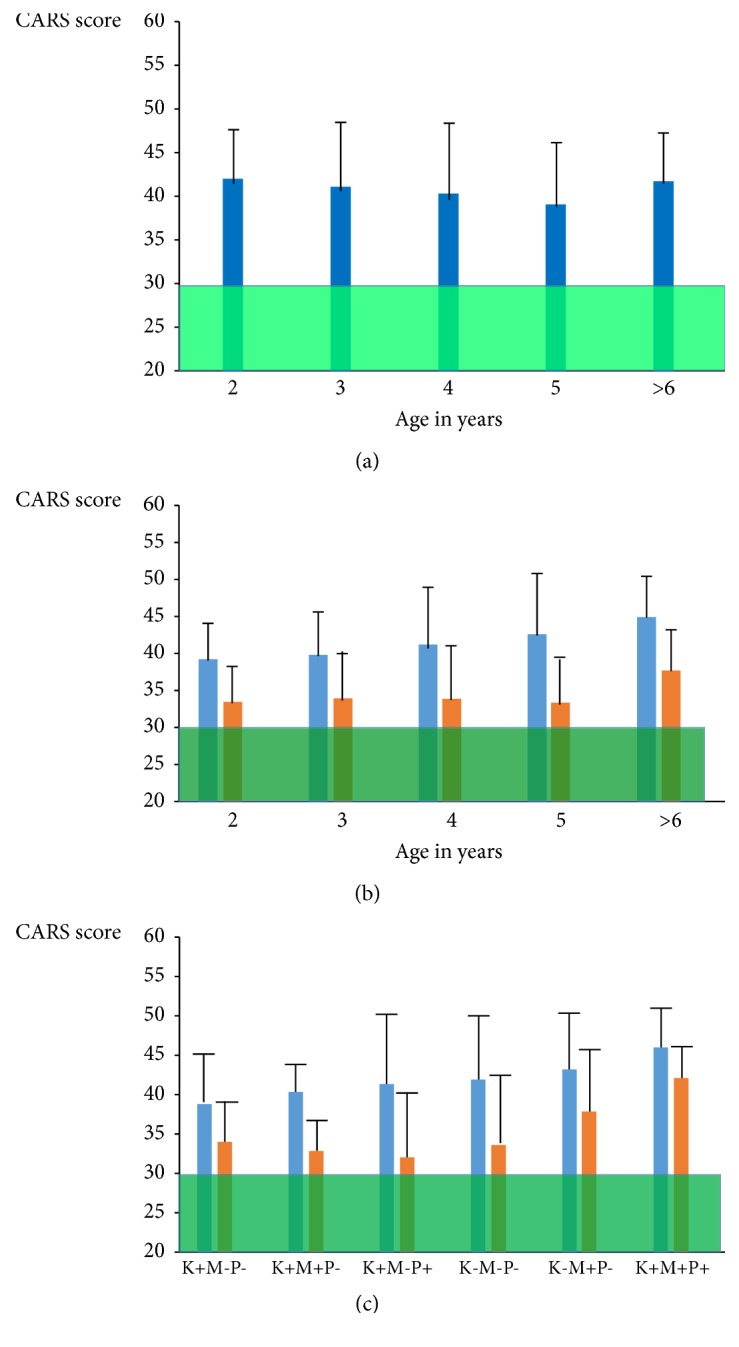
Figure 1.

The upper figure (a) shows the plotted CARS with age for 84 untreated patients. The middle figure (b) shows the effect of treatment among 82 treated patients (blue bars represent CARS at baseline and orange bars the CARS after two years treatment). Figure (c) represents the treatment results among different groups with FR autoantibodies in the child (K), mother (M), or father (P).
