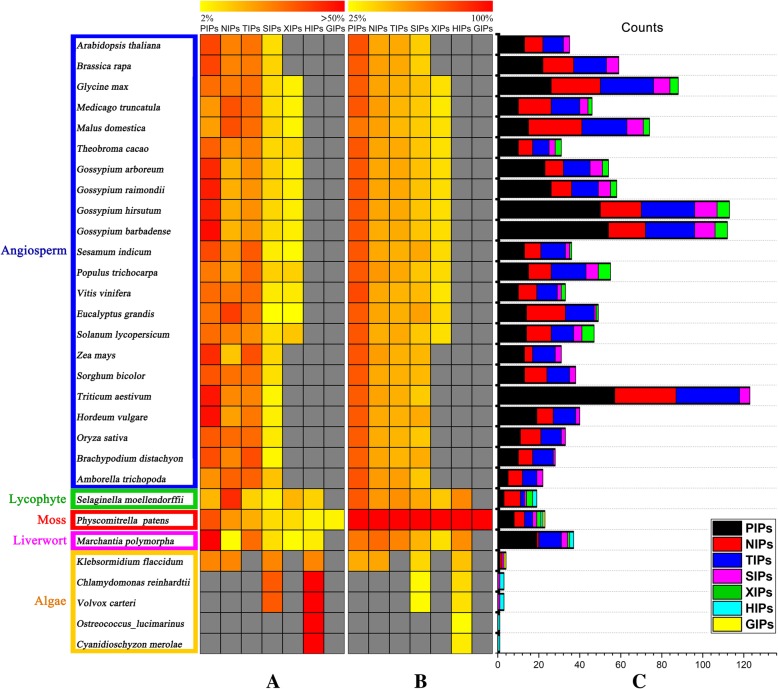
Fig. 3.
Percentage and similarity heat map of predicted AQPs in different species. a, b and c, the GENESIS simulation environment was used to estimate the percentage of AQP subfamilies (a) and the similarity among AQP subfamilies (b). The predicted AQPs were grouped into seven taxa (c). Consistent with previously reported results, candidate AQP genes were selected by BLASTP software searches that satisfied the criteria of E-value < 10− 10 and query coverage > 50%. Colored squares indicated the percentage from 2% (yellow) to > 50% (red) (a) and the sequence similarity from 25% (yellow) to 100% (red) (b). Clades on the left with different colors indicated: angiosperm (blue), lycophyte (green), moss (red), liverwort (pink), and algae (orange). Gray squares indicated that no proteins were found that satisfied the selection criteria (a and b)

