Figure 4.
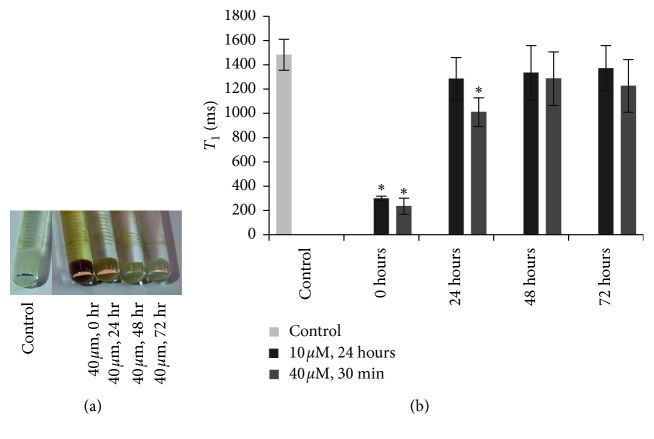
Retention of contrast agent in labeled hESCs. (a) Photograph of cell pellets labeled at 40 μM for 30 min with MnEtP. (b) T 1 relaxation times for unlabeled control cells and cells labeled at 10 μM for 24 h and 40 μM for 30 min, directly after labeling (0), and at 24, 48 and 72 h postlabeling. T 1 reduction returned to baseline levels by 24 h for the 10 μM labeling and by 48 h for the 40 μM labeling conditions. Shown are mean values and standard deviations. Significant differences in T 1 from control pellet are indicated (∗ P < 0.05).

