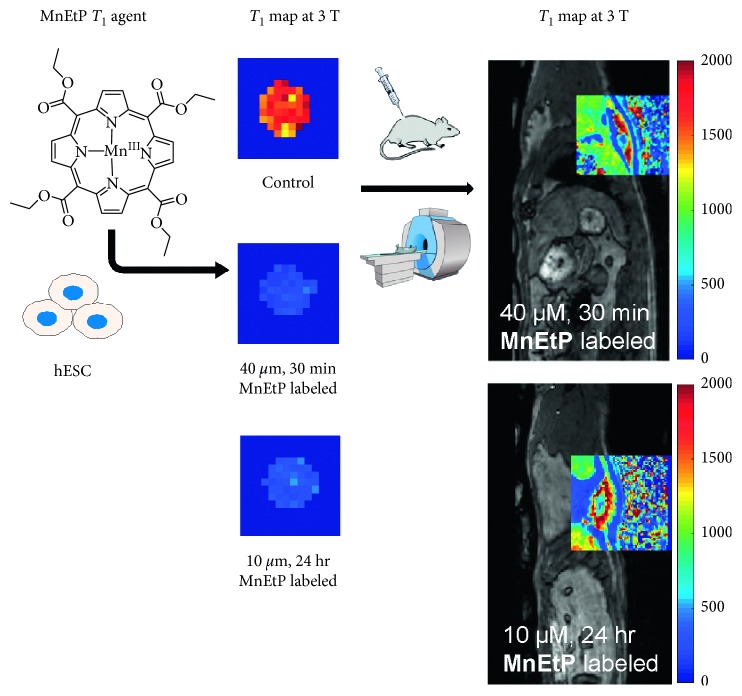
Figure 8.
Comparison of reduction in T 1 relaxation times in vitro and in vivo. An in vivo T 1 map overlaid over the cell injection site shows similar reductions in T 1 relaxation times (in units of ms) compared to cell pellet imaging. The same colour scale is used for both in vitro and in vivo maps.

