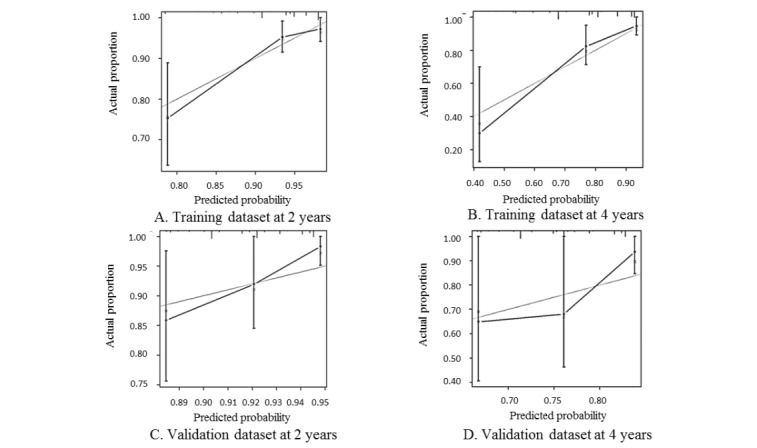
Figure 2.

Calibration plot of the HIV seroconversion risk prediction model for the training dataset at (A) 2 years and (B) 4 years, and for the validation dataset at (C) 2 years and (D) 4 years. The x-axes present the predicted probability of no incident HIV infection; the y-axes present the actual probability of no incident HIV infection. The gray lines are the actual proportion of men who have sex with men without incident HIV infection, the black lines are predicted probabilities, and the vertical capped lines are estimates with the 95% confidence intervals.
