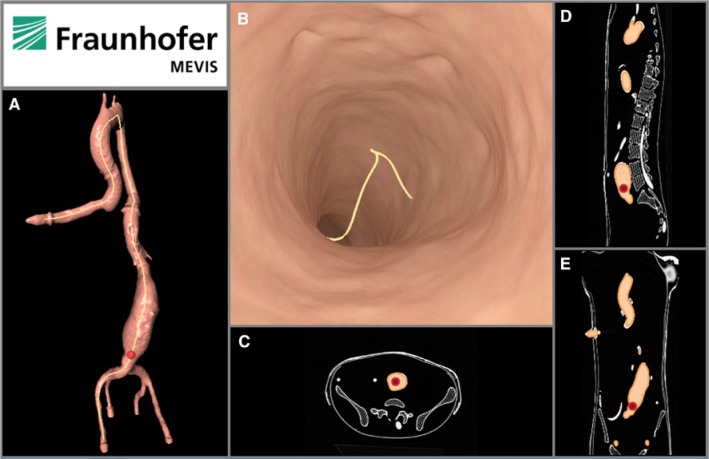
Figure 3:
2D panel built from the radiological data.
(A) 2D image of the 3D vascular model. (B) View (2D image) of the virtual angioscopy. (C) Axial view of the CT scan of the aortic-aneurysm phantom. (D) Sagittal view of that CT scan. (E) Coronal view of that CT scan. The red point and the yellow line represent the position of the catheter tip and a virtual path of the catheter along the vessel centre line respectively.

