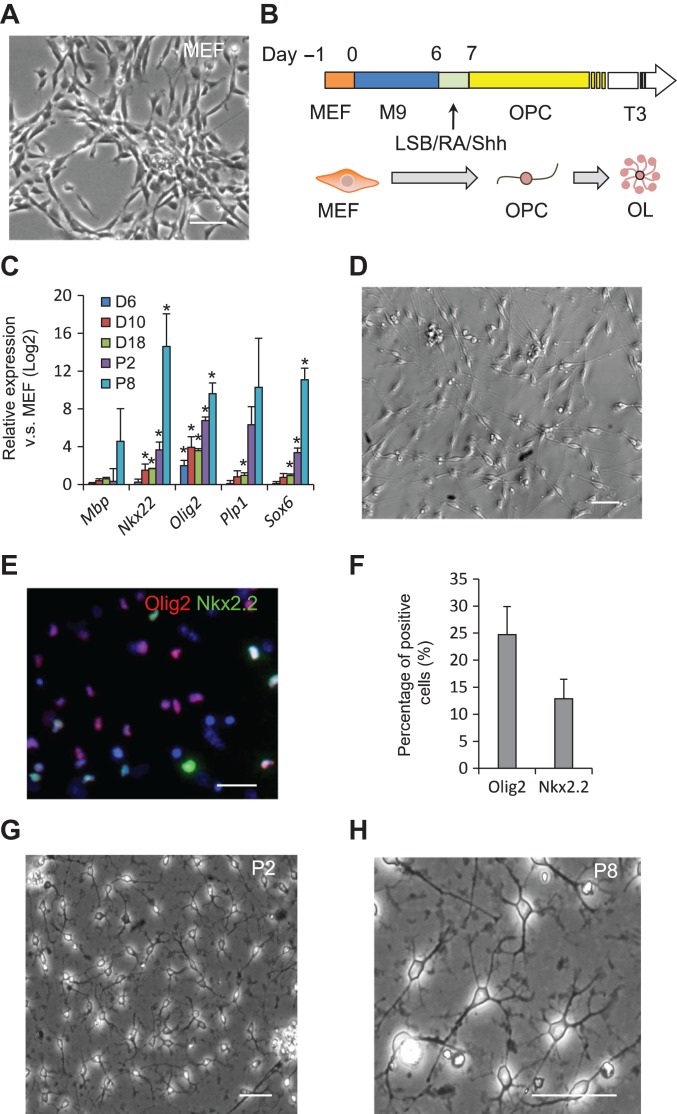
Figure 1.
Reprogramming of MEFs into ciOPLCs. (A, D, G, and H) Morphology of starting MEFs (A), bipolar cells on Day 14 of reprogramming (D), ciOPLCs at passage 2 (G), and passage 8 (H), respectively, was shown. All scale bar, 50 μm. (B) Schematic diagram illustrating the protocol for chemical-induced fibroblasts-to-ciOPLCs reprogramming. LSB, LDN193189, and SB431542. (C) qRT-PCR analysis showing the expression of indicated genes for samples at indicated time points. Relative expression (Log2) was normalized to MEFs. Data are represented as mean ± SEM. *P < 0.01. (E and F) Immunostaining analysis of Olig2+ and Nkx2.2+ cells by Day 14 (E), and the percentage of positive cells was analyzed by InCell software from three independent experiments. Data are represented as mean ± SEM.

