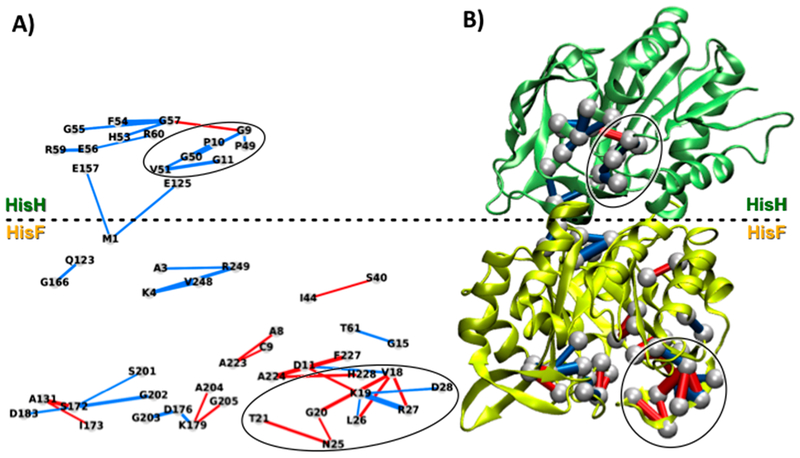
Figure 5.
Perturbation network associated with PRFAR binding to IGPS, computed only for backbone atoms (including hydrogens) and using a weight threshold wt = 5 for the network visualizations. 2D projection (A) and 3D representation (B) of the network, showing reduction (blue lines) and increase (red lines) of the number of contact atoms upon PRFAR binding.

